
An execution plan is SQL Server’s answer to the question “how exactly did you run my query?”. When a query is slow, the plan usually tells you why in a few seconds. The trouble is that the first time you open one, it looks like a wall of icons and percentages.
This guide shows you how to read a plan step by step, which operators matter, and what to look for first. I’ll use a real plan from my own work (with the table names changed) as the example.
How to see an execution plan in SSMS
SQL Server Management Studio gives you two kinds of plan:
| Plan | Shortcut | What it shows |
|---|---|---|
| Estimated execution plan | Ctrl+L | What SQL Server plans to do. The query does not run. |
| Actual execution plan | Ctrl+M, then run the query | What really happened, including the real number of rows at each step. |
Use the actual plan whenever you can. The estimated plan is useful when a query takes too long to run, or when it changes data and you don’t want to run it.
After the query runs, click the Execution plan tab next to Results and Messages.
Rule 1: read from right to left
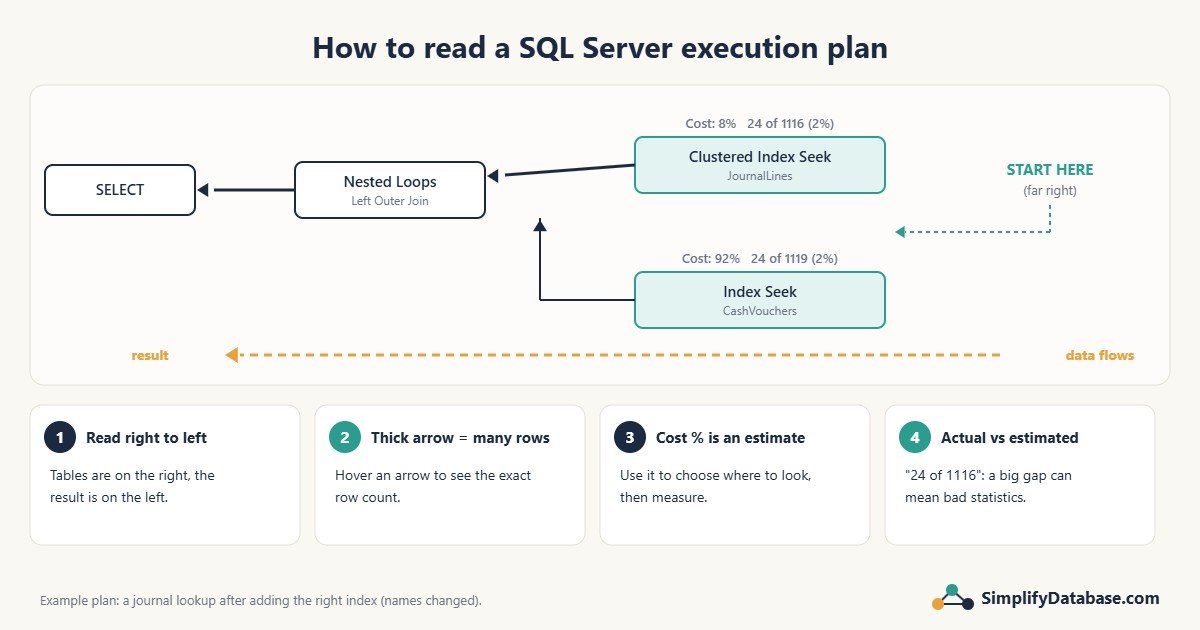
This is the part that confuses everyone. SSMS draws the plan with the result on the left (the SELECT icon) and the tables on the right. Data flows from right to left, along the arrows.
So start at the far right. Those operators are where SQL Server reads your tables. Then follow the arrows to the left and watch how the rows are joined, filtered, sorted and finally returned.
When there are several branches, the top branch is usually the “outer” input of a join and the branch below it is the “inner” input.
Rule 2: arrow thickness shows how many rows move
A thick arrow means many rows. A thin arrow means few. If you expect your query to return 20 rows, but you see a very thick arrow coming out of one table, that table is being read far more than it needs to be. Hover over any arrow to see the exact row count.
Rule 3: cost percentages are a guide, not the truth
Every operator shows Cost: N%. All the percentages add up to 100%, so they only tell you how the work is split inside this one query.
- They are always estimates, even in an actual plan.
- A fast query still adds up to 100%. An operator showing 92% in a query that takes 0 ms is not a problem.
- Use them to decide where to look first, then confirm with real numbers (see “Measure, don’t guess” below).
The operators you will see most often
| Operator | What it means | Good or bad? |
|---|---|---|
| Index Seek / Clustered Index Seek | Jumps straight to the rows it needs using an index. | Usually good when you want a few rows. |
| Index Scan / Clustered Index Scan / Table Scan | Reads the whole index or table. | Fine for small tables or when you need most rows. Suspicious when you want a few rows from a big table. |
| Key Lookup | Found the row in a nonclustered index, then went back to the table for missing columns. | OK for a few rows. Expensive when repeated thousands of times. |
| Nested Loops | For each row on one side, look up matches on the other side. | Great for small inputs. |
| Hash Match | Builds a hash table in memory to join or group large inputs. | Normal for big reports. Suspicious in a query that should return a few rows. |
| Merge Join | Joins two inputs that are already sorted. | Efficient when the data arrives sorted. |
| Sort | Sorts rows for ORDER BY, DISTINCT, a merge join and so on. | Can be costly on large inputs and may spill to tempdb. |
| Index Spool (Eager Spool) | Builds a temporary index while the query runs. | Usually a sign of a missing index. |
A real example, step by step
This query returns the lines of one journal transaction and looks up a cash account for each line:
SELECT
    (SELECT CashAccount
     FROM CashVouchers
     WHERE CashVouchers.DocNo   = JournalLines.DocNo
       AND CashVouchers.DocType = JournalLines.DocType),
    *
FROM JournalLines
WHERE TransNo = 419
  AND JournalCode = '03'
  AND LineType = 1;
Reading its plan from right to left:
- Clustered Index Seek on JournalLines (top right). SQL Server used the primary key to jump to transaction 419. This is good.
- Index Scan on CashVouchers (bottom right, 41%). It read the whole CashVouchers table. That’s the first warning sign: we only need a few vouchers.
- Index Spool (Eager Spool) (58%). It took everything from that scan and built a temporary index. That’s the second warning sign, and the biggest cost.
- Stream Aggregate and Assert. These check that the subquery returns at most one row per line.
- Nested Loops. For each journal line, it looked up the matching voucher.
- SELECT. The 24 rows were returned.
The two warning signs (a scan on a big table plus a spool) both point to one fix: an index on CashVouchers (DocNo, DocType). After adding it, the plan became a Clustered Index Seek plus an Index Seek, joined by Nested Loops. I explain that fix in detail in Eager Index Spool in SQL Server: What It Means and How to Fix It.
Check estimated rows vs actual rows
In an actual plan, newer versions of SSMS show a line like 24 of 1116 (2%) under each operator. It means: SQL Server estimated 1,116 rows, but actually got 24.
- Close numbers: SQL Server understood your data well.
- Very different numbers (10 times or more, either way): SQL Server may have chosen the wrong plan, for example a scan where a seek would be better, or too little memory for a sort. Outdated statistics are a common cause.
UPDATE STATISTICS TableName;is a good first step.
On a small, fast query, a gap like 24 vs 1,116 is harmless. It matters on large queries.
Don’t ignore yellow warning triangles
A small yellow triangle on an operator means SQL Server wants to tell you something. Hover over it, or select the operator and press F4 to open its Properties. Common warnings:
- CONVERT_IMPLICIT: two values with different data types were compared, so SQL Server had to convert one of them. This can stop an index seek. See Index Seek vs Index Scan.
- Missing statistics: SQL Server had no statistics for a column, so its estimates are guesses.
- Spill to tempdb (on Sort or Hash Match): the operator ran out of memory and wrote to disk.
- Excessive memory grant: the query asked for far more memory than it used. Usually not urgent.
Measure, don’t guess
Plans show how the query ran. To know how much work it did, add these lines before your query:
SET STATISTICS IO ON;
SET STATISTICS TIME ON;
The Messages tab then shows logical reads per table (pages read from memory) and CPU and elapsed time. Logical reads are the best number for comparing “before” and “after”, because they don’t change with server load the way time does.
Quick checklist for reading any plan
- Turn on the actual plan (Ctrl+M) and run the query.
- Start at the far right and follow the arrows to the left.
- Look for thick arrows where you expected few rows.
- Look for scans on big tables, Key Lookups repeated many times, and spools.
- Compare actual and estimated rows.
- Check every yellow warning triangle.
- Fix one thing, then compare logical reads before and after.
Part of a series: this article is one step in my SQL Server Performance Troubleshooting: A Practical Step-by-Step Guide, which walks through the whole process of finding and fixing a slow query.
Related articles
- SQL Indexes Explained Simply: the basics of clustered and nonclustered indexes.
- Index Seek vs Index Scan: Why SQL Server Ignores Your Index: what to do when the plan shows a scan.
- Eager Index Spool in SQL Server: the full story of the example above.