
“The system is slow.” Every developer and DBA who works with SQL Server hears it. Sometimes it’s one report, sometimes one screen in the application, sometimes everything at once. The worst thing you can do is start guessing: adding indexes, restarting services or rewriting queries at random.
This guide is the step-by-step process I follow when a SQL Server query or application is slow. It starts with the symptom, then moves to the server, the plan, the indexes and the statistics. Each step links to a detailed article if you need to go deeper.
Step 1: Describe the symptom precisely
“Slow” can mean very different things, and each points to a different cause. Before touching anything, find out which one you have:
| Symptom | Most likely cause | Start with |
|---|---|---|
| One query or report has always been slow | Missing index, badly written query, too much data returned | Step 4 (the plan) |
| It was fast yesterday, suddenly slow today | Blocking, outdated statistics after a big data change, a new plan | Step 2, then Step 7 |
| Slow only sometimes, or only for some users | Blocking, or parameter sniffing (a plan built for different values) | Step 2, then Step 8 |
| Fast in SSMS, slow in the application | Different plan for the app, or the app fetching too many rows | Step 8 |
| Everything is slow | Server-wide pressure: CPU, memory, disk, or one heavy query hurting everyone | Step 2, then Step 9 |
Also write down: which query or screen, roughly how long it takes, how long it used to take, and when it started. You’ll need these numbers to prove your fix worked.
Step 2: See what is running right now
If the problem is happening now, look at the server before anything else. This query shows every running request, what it’s waiting for, and whether another session is blocking it:
SELECT r.session_id,
       r.status,
       r.blocking_session_id,
       r.wait_type,
       r.wait_time          AS wait_ms,
       r.total_elapsed_time AS elapsed_ms,
       r.cpu_time,
       r.logical_reads,
       DB_NAME(r.database_id) AS database_name,
       t.text               AS sql_text
FROM sys.dm_exec_requests AS r
CROSS APPLY sys.dm_exec_sql_text(r.sql_handle) AS t
WHERE r.session_id <> @@SPID
ORDER BY r.total_elapsed_time DESC;
What to look for:
blocking_session_idis not 0: this request is waiting for another session to release a lock. That’s blocking (Step 3).- One request with huge
logical_readsorcpu_time: a heavy query that may be slowing everything else down. Take itssql_textto Step 4. - The
wait_typehints at the resource it’s waiting for.LCK_M_...means locks,PAGEIOLATCH_...means reading from disk,CXPACKET/CXCONSUMERmeans a parallel query, andASYNC_NETWORK_IOusually means the application is slow to read the results.
Step 3: Check for blocking
Blocking is the classic reason for “the system froze for everyone for two minutes, then it was fine”. One session holds locks (for example a long transaction that hasn’t committed) and everyone who needs those rows waits.
-- Who is blocked, and by whom?
SELECT session_id, blocking_session_id, wait_type, wait_time, wait_resource
FROM sys.dm_exec_requests
WHERE blocking_session_id <> 0;

-- What did the blocker run last?
SELECT c.session_id, t.text
FROM sys.dm_exec_connections AS c
CROSS APPLY sys.dm_exec_sql_text(c.most_recent_sql_handle) AS t
WHERE c.session_id = 57;   -- the blocking_session_id from above
Follow the chain to the head blocker: the session that blocks others but isn’t blocked itself. Common causes are transactions left open by an application (a BEGIN TRANSACTION without a COMMIT on an error path), long updates during business hours, and missing indexes that make an UPDATE lock far more rows than it needs. The basics of locks and transactions are in SQL Transactions and ACID Explained Simply.
If nothing is blocked and the server isn’t busy, the problem is the query itself. Move on.
Step 4: Get the actual execution plan and measure
Run the slow query in SSMS with the actual execution plan on (Ctrl+M) and with these two lines first:
SET STATISTICS IO ON;
SET STATISTICS TIME ON;
Write down the logical reads for each table and the elapsed time from the Messages tab. These are your “before” numbers. Logical reads are the most reliable number to compare, because they don’t change with server load the way time does.
If you’ve never read a plan before, start here: How to Read a SQL Server Execution Plan (Beginner’s Guide). It covers reading right to left, arrow thickness, cost percentages and the operators that matter.
Step 5: Look for the usual suspects in the plan
Most slow plans contain one of these:
| You see | It usually means | Read more |
|---|---|---|
| Index Scan / Table Scan on a big table, but few rows come out | No useful index, or the query stops SQL Server from using it | Index Seek vs Index Scan |
| Index Spool (Eager Spool) | SQL Server is building a temporary index on every run | Eager Index Spool in SQL Server |
| Key Lookup repeated thousands of times | The index is missing columns the query needs | Missing Indexes in SQL Server |
| Yellow warning: CONVERT_IMPLICIT | Data types don’t match, so an index can’t be used properly | Index Seek vs Index Scan (Reason 3) |
| Actual rows far from estimated rows | Outdated statistics, or a plan built for different parameter values | Steps 7 and 8 below |
| Warning: spill to tempdb on a Sort or Hash Match | Not enough memory was granted, often because of bad estimates | Step 7 below |
Also check the query itself. Functions on columns in WHERE (like YEAR(OrderDate) = 2026), SELECT *, leading wildcards (LIKE '%abc') and OR across different columns are behind a large share of slow queries. Date filters in particular are covered in SQL Date Functions Explained Simply.
A real example
One of my own cases: a query returning only 24 journal lines had an Index Scan on a voucher table plus an Eager Index Spool taking 58% of the cost. There was no missing index suggestion at all. One index on the two lookup columns turned the plan into two index seeks, and the query ran in under a millisecond. The whole walkthrough is in Eager Index Spool in SQL Server.
Step 6: Fix indexes carefully
When the plan points to a missing index, don’t just copy SQL Server’s green suggestion. Before creating anything:
- Check that the query runs often enough to deserve an index.
- Check the indexes that already exist. Widening an existing index is often better than adding a new one.
- Keep the
INCLUDElist short. FixSELECT *first. - Think about the write cost on busy tables.
- Create it, then compare logical reads with your “before” numbers.
The full method, with the queries, is in Missing Indexes in SQL Server: How to Find Them, and When Not to Add Them. For the basics of how indexes work, see SQL Indexes Explained Simply.
Step 7: Check statistics
SQL Server chooses a plan based on statistics: summaries of how values are spread in each column. If they’re out of date (for example right after a big import, a month-end close or a mass update), SQL Server may expect 100 rows when there are 100,000, or the other way round, and choose a bad plan.
SELECT s.name              AS stats_name,
       sp.last_updated,
       sp.rows,
       sp.modification_counter   -- rows changed since last update
FROM sys.stats AS s
CROSS APPLY sys.dm_db_stats_properties(s.object_id, s.stats_id) AS sp
WHERE s.object_id = OBJECT_ID('dbo.Orders')
ORDER BY sp.modification_counter DESC;
If last_updated is old and modification_counter is large compared to rows, update them and test again:
UPDATE STATISTICS dbo.Orders;If that fixes it, the long-term fix is a regular maintenance job, or updating statistics as the last step of big import jobs.
Step 8: Fast in SSMS, slow in the application
This one confuses everyone. You copy the query from the application, run it in SSMS, and it takes one second. In the application it takes 40 seconds. Common reasons:
- A different plan. The application and SSMS often use different connection settings (for example
ARITHABORT), so SQL Server keeps separate plans for each. The application’s plan may have been built for unusual parameter values. This is called parameter sniffing. A quick test is addingOPTION (RECOMPILE)to the statement. If it becomes fast, a cached plan was the problem. Use that option carefully on queries that run very often, because it compiles a new plan every time. - Different parameter types. The application may send string parameters as
nvarcharwhen the column isvarchar, causing an implicit conversion and a scan. Check the plan forCONVERT_IMPLICIT. - The application reads too much. If the wait type is
ASYNC_NETWORK_IO, SQL Server finished quickly but the application is slow to fetch thousands of rows. Return fewer rows, or page the results.
If you build Delphi applications on SQL Server, the client-side side of this (timeouts, fetch settings, connection handling) is covered in How to Fix Query Timeout and Performance Issues in Delphi Applications.
Step 9: Find the heaviest queries on the whole server
When “everything is slow” and there’s no single query to blame, look for the queries that do the most work overall. This lists the top 10 by total logical reads since their plans were cached:
SELECT TOP (10)
       qs.execution_count,
       qs.total_logical_reads,
       qs.total_logical_reads / qs.execution_count        AS avg_reads,
       qs.total_elapsed_time / qs.execution_count / 1000  AS avg_ms,
       SUBSTRING(st.text, (qs.statement_start_offset / 2) + 1,
           ((CASE qs.statement_end_offset
                 WHEN -1 THEN DATALENGTH(st.text)
                 ELSE qs.statement_end_offset END
             - qs.statement_start_offset) / 2) + 1)       AS query_text
FROM sys.dm_exec_query_stats AS qs
CROSS APPLY sys.dm_exec_sql_text(qs.sql_handle) AS st
ORDER BY qs.total_logical_reads DESC;
A query with modest reads that runs 200,000 times a day can hurt more than one huge report that runs once. Fixing the top two or three often makes the whole server feel faster. If your SQL Server version has Query Store turned on, its built-in reports (“Top Resource Consuming Queries”) show the same thing with history.
Step 10: Measure again and write it down
After each change, run the query again with SET STATISTICS IO ON and compare logical reads and time with your “before” numbers. Change one thing at a time, so you know what actually helped. Then write down what you found and what you changed. The next time someone says “the system is slow”, that note will save you hours.
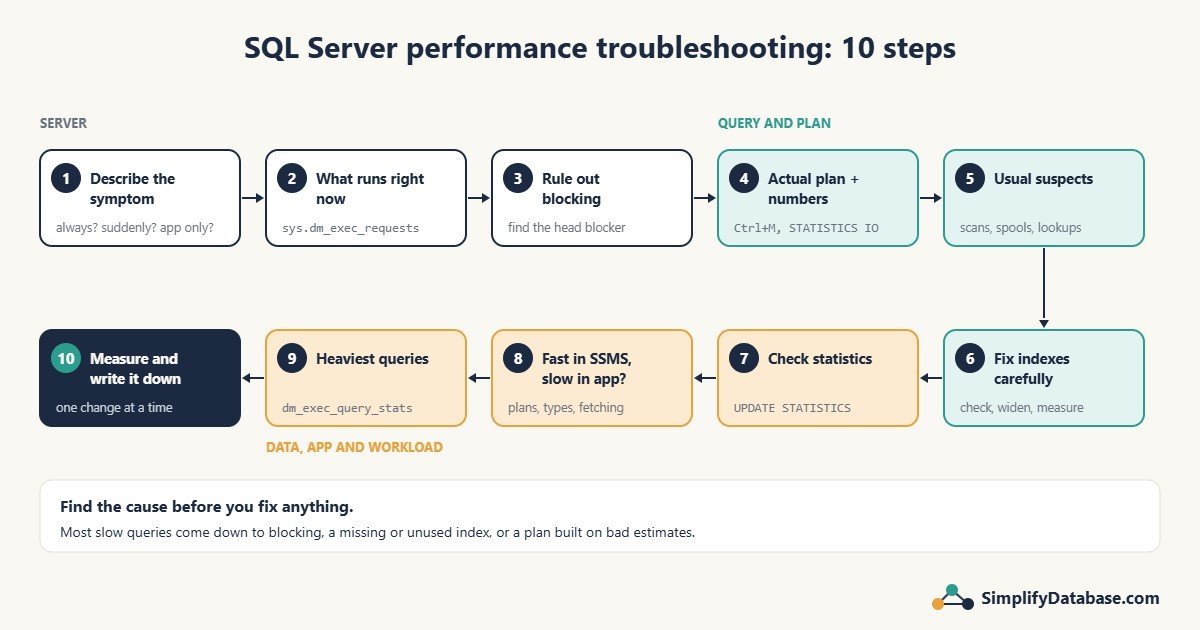
The whole process on one page
- Describe the symptom: always, suddenly, sometimes, only in the app, or everything?
- Look at what’s running now:
sys.dm_exec_requests. - Rule out blocking: find the head blocker.
- Get the actual plan and the “before” numbers.
- Look for scans, spools, Key Lookups, warnings and estimate gaps.
- Fix indexes carefully: check, widen, trim, measure.
- Check and update statistics.
- Fast in SSMS but slow in the app? Check plans, parameter types and fetching.
- Server-wide slowness: find the heaviest queries.
- Measure again, change one thing at a time, and write it down.
All articles in this series
- How to Read a SQL Server Execution Plan (Beginner’s Guide)
- Index Seek vs Index Scan: Why SQL Server Ignores Your Index
- Missing Indexes in SQL Server: How to Find Them, and When Not to Add Them
- Eager Index Spool in SQL Server: What It Means and How to Fix It
- How to Fix Query Timeout and Performance Issues in Delphi Applications
- SQL Indexes Explained Simply
I’ll keep adding to this guide as new articles in the series are published.