
A report that ran in one second yesterday now takes two minutes. Nobody changed the code. You copy the query into SSMS, run it with the same values, and it finishes instantly. Back in the application: still two minutes.
If that sounds familiar, the most likely cause is parameter sniffing. It’s one of the most common and most confusing performance problems in SQL Server, because the query really is fast sometimes and slow other times. This article explains why it happens, how to prove it, and six ways to fix it, with the situations where each fix fits.
Note: the example below is a simplified, made-up example so the numbers are easy to follow. The pattern is the same one you’ll meet in real systems.
What “parameter sniffing” means
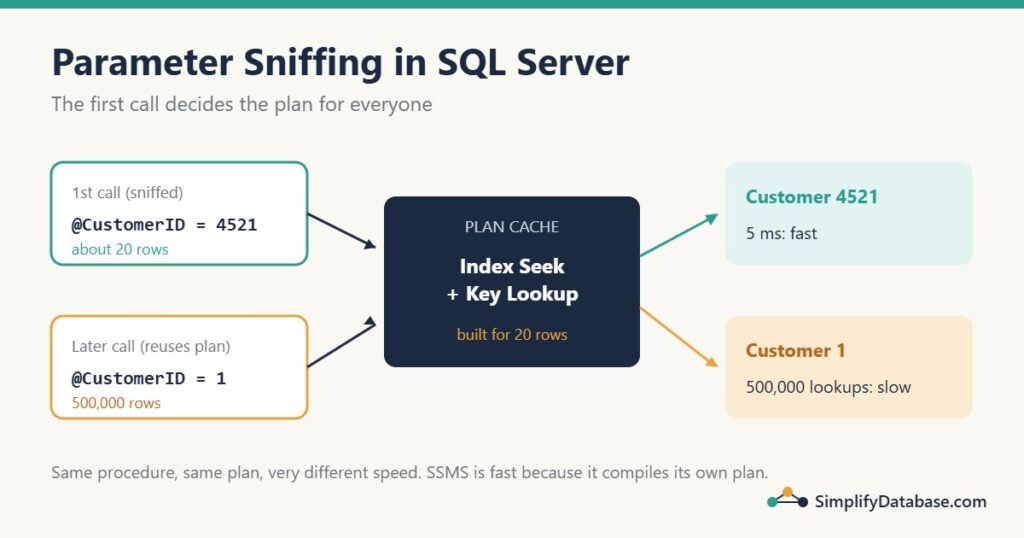
When SQL Server runs a stored procedure (or any parameterised query) for the first time, it builds an execution plan. To choose a good plan, it looks at, or “sniffs”, the parameter values of that first call and estimates how many rows they’ll return.
Then it saves the plan in the plan cache and reuses it for every later call, whatever values those calls use. Building a plan costs CPU, so reusing it is normally a good thing.
The problem starts when different values need very different plans. A plan that’s perfect for 20 rows can be terrible for 500,000 rows, and the other way round.
A simple example
An Orders table has 2 million rows. Most customers have 10 to 50 orders, but one big wholesale customer (CustomerID 1) has 500,000. There’s a nonclustered index on CustomerID.
CREATE PROCEDURE dbo.GetCustomerOrders
    @CustomerID int
AS
SELECT OrderID, OrderDate, TotalAmount, Status
FROM dbo.Orders
WHERE CustomerID = @CustomerID;
Scenario 1: a small customer runs first. Monday morning, the first call is for customer 4521 (20 orders). SQL Server sniffs 4521, expects about 20 rows and picks an Index Seek + Key Lookup plan: find the 20 rows in the index, then fetch the other columns for each. Fast and cheap. The plan is cached.
Later, someone opens customer 1. SQL Server reuses the cached plan, and now does 500,000 key lookups, one at a time. That’s millions of page reads instead of a quick scan. The call takes a minute or more.
Scenario 2: the big customer runs first (for example after a restart or a statistics update). SQL Server builds a plan for 500,000 rows: a scan of the table, maybe with parallelism and a large memory grant. Now every small customer gets that heavy plan too. Each call takes 2 seconds instead of 5 milliseconds, and because it happens on every screen, the whole application feels slow.
Same procedure, same code, different speed, depending on which value happened to run first. That’s parameter sniffing.
Why it’s fast in SSMS but slow in the app
This is the part that confuses everyone. You run EXEC dbo.GetCustomerOrders 1 in SSMS and it’s fast. Why?
Because SSMS usually doesn’t reuse the application’s plan. Plans are cached per set of connection settings, and SSMS turns SET ARITHABORT ON by default, while most applications (ADO.NET, ODBC, OLE DB, and Delphi apps using FireDAC or ADO) connect with it OFF. Different settings mean a different cache entry, so SSMS compiles a fresh plan for the value you typed, and it’s a good plan for that value.
So SSMS isn’t lying, it’s just not running the same plan as the application. (ARITHABORT itself isn’t the problem; it’s only why the two get separate plans. Don’t “fix” this by changing it in the application.)
To see the app’s slow behaviour in SSMS, match its settings first:
SET ARITHABORT OFF;
EXEC dbo.GetCustomerOrders @CustomerID = 1;
How to confirm it’s parameter sniffing
1. Compare the compiled and runtime values. Get the actual execution plan of the slow call, click the root operator (the SELECT at the far left) and open Properties (F4). Under Parameter List you’ll see two values for each parameter:
- Parameter Compiled Value: the value the plan was built for, for example
4521. - Parameter Runtime Value: the value used now, for example
1.
If they’re different, and the plan’s estimated rows (about 20) are far from the actual rows (500,000), you’ve found it.
2. Look at the cached plan’s history. If a query’s minimum and maximum duration are wildly different, the same plan is fast for some values and slow for others:
SELECT TOP (20)
       qs.execution_count,
       qs.min_elapsed_time / 1000 AS min_ms,
       qs.max_elapsed_time / 1000 AS max_ms,
       qs.min_logical_reads,
       qs.max_logical_reads,
       SUBSTRING(t.text, 1, 200) AS query_start
FROM sys.dm_exec_query_stats AS qs
CROSS APPLY sys.dm_exec_sql_text(qs.sql_handle) AS t
WHERE t.text LIKE '%GetCustomerOrders%'
ORDER BY qs.max_elapsed_time DESC;
3. Use Query Store (SQL Server 2016 and later, if it’s enabled). The Regressed Queries and Queries With High Variation reports show queries that have more than one plan, with the timing of each. You can often see the exact moment a good plan was replaced by a bad one.
The quick emergency fix
When users are waiting, you can throw away the bad plan for that one procedure so the next call compiles a new one:
EXEC sp_recompile N'dbo.GetCustomerOrders';This only buys time: the next “unlucky” first call can bring the problem back. And don’t run DBCC FREEPROCCACHE with no arguments on a production server. It clears every plan on the instance, and the server will be busy recompiling everything for a while.
Six real fixes, and when to use each
1. Fix the index so the choice doesn’t matter
Often the best fix isn’t about sniffing at all. The plan is fragile because the index forces a choice between “seek + many lookups” and “scan”. A covering index removes the lookups, so the seek plan is good for 20 rows and for 500,000:
CREATE INDEX IX_Orders_CustomerID_Covering
ON dbo.Orders (CustomerID)
INCLUDE (OrderDate, TotalAmount, Status);
Use when: the query returns a few columns and the plan flips between seek + key lookup and scan. Read Index Seek vs Index Scan for the reasoning.
2. OPTION (RECOMPILE)
Build a fresh plan on every call, for the exact values used:
SELECT OrderID, OrderDate, TotalAmount, Status
FROM dbo.Orders
WHERE CustomerID = @CustomerID
OPTION (RECOMPILE);
Use when: the query runs a few times a minute or less (reports, searches, month-end jobs), so the compile cost doesn’t matter. Avoid when: it runs hundreds of times per second; compiling every time will burn CPU. Prefer the statement-level hint over WITH RECOMPILE on the whole procedure: it only recompiles the statement that needs it.
3. OPTIMIZE FOR a typical value
Tell SQL Server which value to build the plan for, whatever the first call uses:
SELECT OrderID, OrderDate, TotalAmount, Status
FROM dbo.Orders
WHERE CustomerID = @CustomerID
OPTION (OPTIMIZE FOR (@CustomerID = 4521));
Use when: almost all calls look alike and you’re happy for the rare big value to be slower. Risk: if the data changes and 4521 is no longer typical, the hint quietly becomes wrong.
4. OPTIMIZE FOR UNKNOWN
Build the plan for an “average” value, using the statistics’ density instead of the sniffed value:
OPTION (OPTIMIZE FOR UNKNOWN);This gives a stable, middle-of-the-road plan. It’s rarely the best plan for anyone, but it’s rarely a disaster either. Copying the parameter into a local variable inside the procedure has the same effect; the hint is clearer about why.
5. Separate code paths for very different values
When you know which values are “big”, give them their own procedure, so each gets its own plan:
CREATE PROCEDURE dbo.GetCustomerOrders
    @CustomerID int
AS
IF EXISTS (SELECT 1 FROM dbo.LargeCustomers WHERE CustomerID = @CustomerID)
    EXEC dbo.GetCustomerOrders_Large @CustomerID;
ELSE
    EXEC dbo.GetCustomerOrders_Small @CustomerID;
Use when: a small, known group of values (a few big customers, branches or accounts) behaves very differently from the rest. It’s more code to maintain, so keep it for important queries.
6. Force a good plan with Query Store, or let SQL Server 2022 handle it
If Query Store shows a plan that was good for everyone, you can force it from the Regressed Queries report (Force Plan), or with sp_query_store_force_plan. No code changes are needed, which is useful when you can’t change the application.
SQL Server 2022 (database compatibility level 160) adds Parameter Sensitive Plan optimization, which can keep several cached plans for one query and choose between them based on the parameter value. It helps with the classic “one huge customer” case, but it doesn’t cover every query, so the fixes above are still worth knowing.
Which fix should I choose?
| Situation | Try first |
|---|---|
| Plan flips between seek + key lookup and scan | 1. Covering index |
| Query runs rarely (reports, month-end, searches) | 2. OPTION (RECOMPILE) |
| Nearly all values are similar, a few are huge | 3. OPTIMIZE FOR a typical value, or 5. separate paths |
| You need a predictable plan and can live with “OK” | 4. OPTIMIZE FOR UNKNOWN |
| You can’t change the code | 6. Query Store forced plan |
| Users are waiting right now | sp_recompile on that procedure, then a real fix |
When it’s NOT parameter sniffing
Before you add hints, rule out the usual look-alikes:
- Blocking: the query is waiting on locks, not doing work.
blocking_session_idinsys.dm_exec_requestsis not 0. See step 3 of the troubleshooting guide. - Out-of-date statistics: the plan is wrong for every value, not just some. Updating statistics fixes it (and also forces a recompile, which can hide sniffing for a while).
- The application reads slowly: the wait type is
ASYNC_NETWORK_IO. SQL Server finished quickly; the app is fetching rows one by one or loading too many. This is common in desktop apps, see How to Fix Query Timeout Issues in Delphi Applications. - Data type mismatch: an
nvarcharparameter compared to avarcharcolumn can cause a scan for every value. That’s an implicit conversion, not sniffing.
A note for Delphi and .NET developers
Parameter sniffing doesn’t only affect stored procedures. When your application sends a parameterised query, for example a FireDAC TFDQuery with :CustomerID, or an ADO.NET SqlCommand with @CustomerID, the driver sends it as a parameterised batch (usually through sp_executesql or sp_prepexec). SQL Server caches and reuses that plan exactly like a procedure’s, so the same sniffing can happen.
That’s not a reason to stop using parameters: they protect you from SQL injection and normally make things faster. It just means the fixes above apply to your application’s queries too. Adding OPTION (RECOMPILE) to the SQL text of a rarely-run report query is often the simplest fix.
Checklist
- Is it fast for some values and slow for others, or fast in SSMS and slow in the app?
- In the slow actual plan, are the compiled and runtime parameter values different?
- Are the estimated rows far from the actual rows?
- Have you ruled out blocking, stale statistics and
ASYNC_NETWORK_IO? - Can a better index make one plan good for every value?
- If not:
RECOMPILEfor rare queries,OPTIMIZE FORor separate paths for frequent ones. - Measure before and after (
SET STATISTICS IO, TIME ON) for both a small and a large value.
Part of a series: this article is one step in my SQL Server Performance Troubleshooting: A Practical Step-by-Step Guide, which walks through the whole process of finding and fixing a slow query.
Related articles
- How to Read a SQL Server Execution Plan: find the estimated vs actual rows and the parameter values.
- Index Seek vs Index Scan: why the plan flips between seek and scan.
- SQL Stored Procedures Explained Simply: how procedures and their parameters work.
- Missing Indexes in SQL Server: decide whether the covering index is worth it.