
“Which invoice numbers are missing?” “What’s each customer’s longest streak of daily logins?” “When was the machine stopped, and for how long?”
These sound like three different problems, but SQL people call them all gaps and islands. An island is a run of consecutive values (invoice numbers 1001, 1002, 1003; logins on Monday, Tuesday, Wednesday). A gap is the hole between two islands. Once you know the two tricks in this article, all three questions take a few lines of SQL.
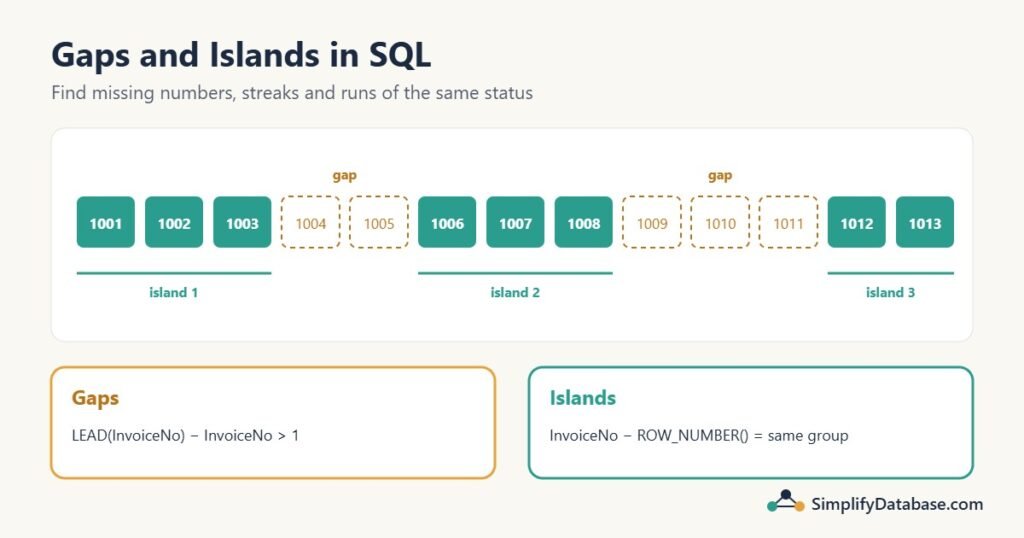
Table of Contents
The sample data
An Invoices table where some numbers were never issued (or were deleted):
CREATE TABLE Invoices (
    InvoiceNo   INT PRIMARY KEY,
    InvoiceDate DATE
);

INSERT INTO Invoices VALUES
(1001, '2026-10-01'), (1002, '2026-10-01'), (1003, '2026-10-02'),
(1006, '2026-10-03'), (1007, '2026-10-03'), (1008, '2026-10-04'),
(1012, '2026-10-05'), (1013, '2026-10-06');
Numbers 1004-1005 and 1009-1011 are missing. In many countries, auditors ask exactly this question about sequential invoice numbers.
Finding gaps with LEAD
LEAD(column) returns the value from the next row. Put each invoice number next to the following one, and wherever the difference is more than 1, there’s a gap:
SELECT InvoiceNo + 1            AS GapStart,
       NextNo - 1               AS GapEnd,
       NextNo - InvoiceNo - 1   AS Missing
FROM (
    SELECT InvoiceNo,
           LEAD(InvoiceNo) OVER (ORDER BY InvoiceNo) AS NextNo
    FROM Invoices
) AS x
WHERE NextNo - InvoiceNo > 1;| GapStart | GapEnd | Missing |
|---|---|---|
| 1004 | 1005 | 2 |
| 1009 | 1011 | 3 |
That’s the whole gaps problem: compare each row with its neighbour. LEAD and its partner LAG (the previous row) are window functions, available in SQL Server 2012+, MySQL 8+ and PostgreSQL.
The LEAD runs inside a subquery because a window function can’t be used directly in WHERE. Calculate first, filter outside.
Finding islands with the ROW_NUMBER trick
Now the opposite: list the ranges of numbers that do exist (1001-1003, 1006-1008, 1012-1013). This is the famous trick, so let’s look at it step by step.
Number the rows with ROW_NUMBER() and subtract that from the invoice number:
SELECT InvoiceNo,
       ROW_NUMBER() OVER (ORDER BY InvoiceNo)             AS rn,
       InvoiceNo - ROW_NUMBER() OVER (ORDER BY InvoiceNo) AS grp
FROM Invoices;| InvoiceNo | rn | grp |
|---|---|---|
| 1001 | 1 | 1000 |
| 1002 | 2 | 1000 |
| 1003 | 3 | 1000 |
| 1006 | 4 | 1002 |
| 1007 | 5 | 1002 |
| 1008 | 6 | 1002 |
| 1012 | 7 | 1005 |
| 1013 | 8 | 1005 |
Look at the grp column. Inside a run of consecutive numbers, the invoice number and the row number both go up by 1, so their difference stays the same. When there’s a gap, the invoice number jumps but the row number doesn’t, so the difference changes. Every island gets its own grp value.
The actual value of grp means nothing; it’s just a label. Group by it:
SELECT MIN(InvoiceNo) AS FromNo,
       MAX(InvoiceNo) AS ToNo,
       COUNT(*)       AS Invoices
FROM (
    SELECT InvoiceNo,
           InvoiceNo - ROW_NUMBER() OVER (ORDER BY InvoiceNo) AS grp
    FROM Invoices
) AS x
GROUP BY grp
ORDER BY FromNo;| FromNo | ToNo | Invoices |
|---|---|---|
| 1001 | 1003 | 3 |
| 1006 | 1008 | 3 |
| 1012 | 1013 | 2 |
Islands of dates: login streaks
The same trick works with dates, which is where it gets really useful. A Logins table records every login, sometimes several per day:
CREATE TABLE Logins (UserID INT, LoginTime DATETIME);

INSERT INTO Logins VALUES
(1, '2026-10-01 08:10'), (1, '2026-10-02 09:00'), (1, '2026-10-02 18:30'),
(1, '2026-10-03 07:45'), (1, '2026-10-06 10:00'), (1, '2026-10-07 11:20'),
(2, '2026-10-01 12:00'), (2, '2026-10-03 12:00'), (2, '2026-10-04 13:00'),
(2, '2026-10-05 08:00'), (2, '2026-10-06 09:15');
The question: what are each user’s streaks of consecutive login days?
Two adjustments compared with invoice numbers:
- One row per user per day first. User 1 logged in twice on October 2. If both rows stay, the row number goes up twice while the date goes up once, and the trick breaks.
SELECT DISTINCTon the date fixes that. - Subtract days, not numbers, and restart the numbering for each user with
PARTITION BY UserID.
WITH Days AS (
    SELECT DISTINCT UserID, CAST(LoginTime AS DATE) AS LoginDate
    FROM Logins
),
Grouped AS (
    SELECT UserID, LoginDate,
           DATEADD(day,
                   -ROW_NUMBER() OVER (PARTITION BY UserID ORDER BY LoginDate),
                   LoginDate) AS grp
    FROM Days
)
SELECT UserID,
       MIN(LoginDate) AS StreakStart,
       MAX(LoginDate) AS StreakEnd,
       COUNT(*)       AS Days
FROM Grouped
GROUP BY UserID, grp
ORDER BY UserID, StreakStart;

-- MySQL: DATE_SUB(LoginDate, INTERVAL ROW_NUMBER() OVER (...) DAY) AS grp| UserID | StreakStart | StreakEnd | Days |
|---|---|---|---|
| 1 | 2026-10-01 | 2026-10-03 | 3 |
| 1 | 2026-10-06 | 2026-10-07 | 2 |
| 2 | 2026-10-01 | 2026-10-01 | 1 |
| 2 | 2026-10-03 | 2026-10-06 | 4 |
Here grp is a date: “the login date minus its row number in days”. For consecutive days it stays the same date, exactly like before. Put the final query in one more CTE, and MAX(Days) per user gives the longest streak: 3 for user 1 and 4 for user 2.
The same pattern answers “consecutive months with a sale”, “days in a row a product was out of stock”, or “employees absent three or more days in a row”. Just change what counts as one step (day, month) and what you partition by.
Islands of a status: when was the machine stopped?
Sometimes the values aren’t consecutive numbers at all; you want runs of the same status. A machine reports its status every 15 minutes:
CREATE TABLE MachineStatus (ReadingTime DATETIME, Status VARCHAR(10));

INSERT INTO MachineStatus VALUES
('2026-10-20 08:00', 'Running'), ('2026-10-20 08:15', 'Running'),
('2026-10-20 08:30', 'Stopped'), ('2026-10-20 08:45', 'Stopped'),
('2026-10-20 09:00', 'Stopped'), ('2026-10-20 09:15', 'Running'),
('2026-10-20 09:30', 'Running'), ('2026-10-20 09:45', 'Stopped'),
('2026-10-20 10:00', 'Running');
The ROW_NUMBER subtraction doesn’t fit here. Use the second classic trick instead: flag every change, then count the flags.
- With
LAG, mark a row with 1 when its status differs from the previous row (a new island starts), else 0. - A running
SUMof those flags gives every island its own number.
WITH Flagged AS (
    SELECT ReadingTime, Status,
           CASE WHEN Status = LAG(Status) OVER (ORDER BY ReadingTime)
                THEN 0 ELSE 1 END AS IsNew
    FROM MachineStatus
),
Numbered AS (
    SELECT ReadingTime, Status,
           SUM(IsNew) OVER (ORDER BY ReadingTime ROWS UNBOUNDED PRECEDING) AS Island
    FROM Flagged
)
SELECT Island, Status,
       MIN(ReadingTime) AS FromTime,
       MAX(ReadingTime) AS LastReading,
       COUNT(*)         AS Readings
FROM Numbered
GROUP BY Island, Status
ORDER BY Island;| Island | Status | FromTime | LastReading | Readings |
|---|---|---|---|---|
| 1 | Running | 08:00 | 08:15 | 2 |
| 2 | Stopped | 08:30 | 09:00 | 3 |
| 3 | Running | 09:15 | 09:30 | 2 |
| 4 | Stopped | 09:45 | 09:45 | 1 |
| 5 | Running | 10:00 | 10:00 | 1 |
The first row has no previous row, so LAG returns NULL, the comparison isn’t true, and it’s flagged as a new island. That’s what we want.
To get how long each stop lasted, the end of an island is the start of the next one: add LEAD(MIN(ReadingTime)) OVER (ORDER BY Island) AS ToTime to the final query, then DATEDIFF(minute, FromTime, ToTime). The first stop ran from 08:30 until the machine was running again at 09:15: 45 minutes. The running SUM here is the same idea as in Running Totals in SQL Server.
This flag-and-count method is the more general of the two tricks. It works for any “runs of the same value” problem, including the earlier ones, as long as you can say what “the same as the previous row” means.
Gaps in dates: days with no data
What about dates with no rows at all, like a day with no invoices? You can’t find a row that isn’t there by looking at the table alone, so generate the full list of dates and look for the ones without a match:
WITH Calendar AS (
    SELECT CAST('2026-10-01' AS date) AS TheDate
    UNION ALL
    SELECT DATEADD(day, 1, TheDate) FROM Calendar WHERE TheDate < '2026-10-07'
)
SELECT c.TheDate AS DayWithoutInvoices
FROM Calendar AS c
LEFT JOIN Invoices AS i ON i.InvoiceDate = c.TheDate
WHERE i.InvoiceNo IS NULL;
With the sample data, only October 7 has no invoices. The LEFT JOIN ... WHERE ... IS NULL pattern keeps calendar days that have no match. A permanent calendar table works the same way, and you’ll need one for many reports, like month-over-month comparisons with missing months.
Performance notes
- All these queries sort by the ordering column. An index on it (or on
UserID, LoginDatefor the partitioned version) lets SQL Server read the rows already sorted instead of sorting them. LEAD/LAGandROW_NUMBERread the table once. The older ways of solving these problems used self-joins or correlated subqueries (“find the smallest number greater than this one”), which get very slow on big tables. If you find one of those in old code, it’s a good candidate for a rewrite.
Common mistakes
- Not removing duplicates first. Two logins on the same day, or the same invoice number twice, break the ROW_NUMBER trick. Use
DISTINCT(orDENSE_RANKinstead ofROW_NUMBER). - Forgetting
PARTITION BYwhen you want islands per user, product or machine. Without it, one user’s streak runs into the next user’s. - Using a window function in
WHERE. It isn’t allowed. Wrap it in a CTE or subquery. - Expecting to find missing dates without a calendar. A query can only see rows that exist.
- Treating
grpas meaningful. It’s just a label to group by.
Practice exercises
Exercise 1. Using Invoices, list every day and how many invoices were issued that day, with the days in order. Then find the islands of consecutive days that have at least one invoice.
Exercise 2. Using Logins, return each user’s longest streak in days.
Exercise 3. Using MachineStatus, how many separate times did the machine stop?
Answers
Answer 1. Group by date for the first part. For the islands, use the date trick on the distinct dates:
WITH d AS (SELECT DISTINCT InvoiceDate FROM Invoices)
SELECT MIN(InvoiceDate) AS FromDate, MAX(InvoiceDate) AS ToDate, COUNT(*) AS Days
FROM (
    SELECT InvoiceDate,
           DATEADD(day, -ROW_NUMBER() OVER (ORDER BY InvoiceDate), InvoiceDate) AS grp
    FROM d
) AS x
GROUP BY grp;
All six dates from October 1 to October 6 are consecutive, so there’s one island of 6 days.
Answer 2. Wrap the streak query and take the maximum:
WITH Days AS (
    SELECT DISTINCT UserID, CAST(LoginTime AS DATE) AS LoginDate FROM Logins
),
Grouped AS (
    SELECT UserID, LoginDate,
           DATEADD(day, -ROW_NUMBER() OVER (PARTITION BY UserID ORDER BY LoginDate), LoginDate) AS grp
    FROM Days
),
Streaks AS (
    SELECT UserID, COUNT(*) AS StreakDays FROM Grouped GROUP BY UserID, grp
)
SELECT UserID, MAX(StreakDays) AS LongestStreak
FROM Streaks
GROUP BY UserID;
User 1: 3 days. User 2: 4 days.
Answer 3. Count the islands whose status is Stopped: wrap the status query in a CTE and add WHERE Status = 'Stopped' with COUNT(*). The answer is 2 (08:30-09:00 and 09:45).
Summary
- Gaps: compare each row with the next using
LEAD(or the previous withLAG). - Islands of consecutive values:
value - ROW_NUMBER()is constant within an island; group by it. For dates, subtract the row number in days. - Islands of the same status: flag each change with
LAG, then a runningSUMnumbers the islands. - Remove duplicates first, partition per user or item, and use a calendar to find dates with no rows at all.
Related articles
- SQL Window Functions Explained Simply: ROW_NUMBER, LAG, LEAD and friends.
- Running Totals in SQL Server: the running SUM behind the status trick.
- Month-over-Month and Year-over-Year Comparisons in SQL: another report where missing periods matter.
- Top N per Group in SQL Server: more ROW_NUMBER patterns for reports.