
A Laravel page that took 200 milliseconds when you built it now takes four seconds. The code hasn’t changed; the data has grown. Somewhere, a query that was fine with 500 rows is struggling with 500,000.
The good news is that Laravel gives you excellent tools to see every query a page runs. This guide shows how to find the slow queries (in development and in production), how to understand them with EXPLAIN, and the six fixes that solve most Laravel database slowness. The examples use MySQL, but the ideas apply to any database.
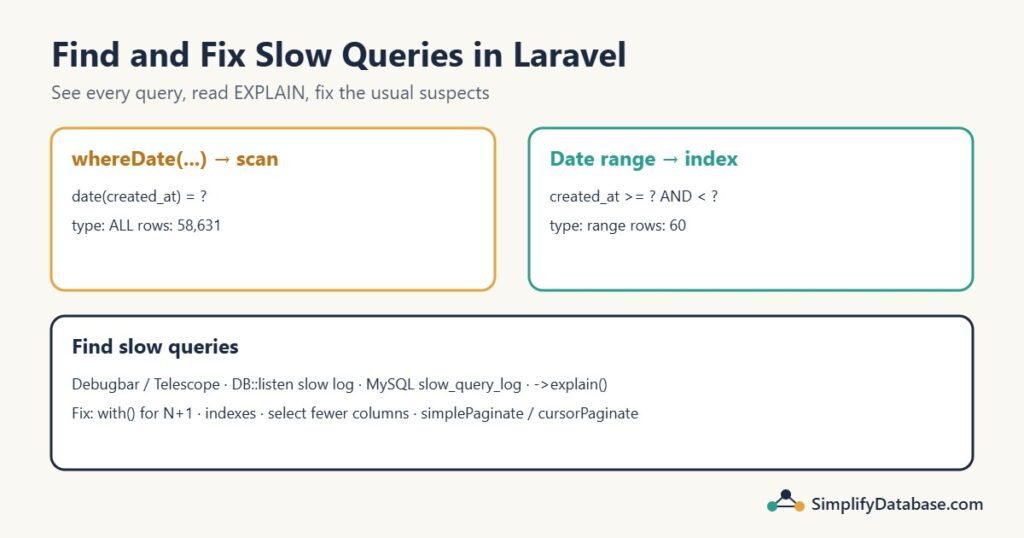
Table of Contents
Step 1: See every query a page runs
In development: Debugbar or Telescope
The fastest way to see what a page does is Laravel Debugbar (composer require barryvdh/laravel-debugbar --dev). It adds a bar to the bottom of every page with a Queries tab: every SQL statement, its bindings, its time, and a warning when the same query runs many times. That last part is how you spot N+1 problems in seconds.
Laravel Telescope (composer require laravel/telescope --dev) does the same in a separate dashboard, and also covers queued jobs, commands and API requests that have no page to show a bar on. It tags queries slower than 100 ms as slow by default (the threshold is in config/telescope.php).
Neither belongs on a public production site without protection: they show your SQL and data to anyone who can see them.
Anywhere: log slow queries yourself
To catch slow queries in production, register a listener in AppServiceProvider::boot():
use Illuminate\Database\Events\QueryExecuted;
use Illuminate\Support\Facades\DB;
use Illuminate\Support\Facades\Log;

public function boot(): void
{
    DB::listen(function (QueryExecuted $query) {
        if ($query->time > 500) {                 // milliseconds
            Log::warning('Slow query', [
                'sql'      => $query->sql,
                'bindings' => $query->bindings,
                'time_ms'  => $query->time,
                'url'      => request()->fullUrl(),
            ]);
        }
    });
}
Now every query over half a second ends up in storage/logs/laravel.log with the page that ran it. Laravel also has DB::whenQueryingForLongerThan(2000, function ($connection, $event) { ... }), which fires when the total time spent on queries during one request passes the limit. That’s useful for catching pages that run hundreds of small queries, none of them slow on its own.
In the database: the MySQL slow query log
MySQL can log slow queries itself, whatever application sent them:
SET GLOBAL slow_query_log = 'ON';
SET GLOBAL long_query_time = 1;        -- seconds
SHOW VARIABLES LIKE 'slow_query_log_file';
Add these to the MySQL configuration file (my.cnf or my.ini) to keep them after a restart. The mysqldumpslow tool summarizes the log by query pattern, so you see which query shape costs the most in total.
Step 2: Find out why with EXPLAIN
Once you have the slow query, ask MySQL how it runs it. Laravel can do that directly from the query builder:
Order::where('customer_id', 42)->where('status', 'paid')->explain()->dd();Or run EXPLAIN in front of the SQL in any MySQL client. The columns that matter most:
| Column | What to look for |
|---|---|
type | ALL means a full table scan (bad on big tables). ref, range, eq_ref, const mean an index is used. |
key | Which index MySQL chose. NULL means none. |
rows | How many rows MySQL expects to read. Compare it with how many you actually need. |
Extra | Using filesort or Using temporary on big results are worth a look. |
Here’s a real example on a test table of 60,000 orders with an index on created_at:
EXPLAIN SELECT * FROM orders WHERE date(created_at) = '2025-03-01';
-- type: ALL    key: NULL                      rows: 58631

EXPLAIN SELECT * FROM orders
WHERE created_at >= '2025-03-01' AND created_at < '2025-03-02';
-- type: range  key: orders_created_at_index   rows: 60
Same question, same index. The first reads the whole table; the second reads about 60 rows. Why is the subject of the first fix below.
Step 3: The six common fixes
Fix 1: Stop the N+1 queries
The most common Laravel performance problem by far. Code like this:
$orders = Order::latest()->take(50)->get();

foreach ($orders as $order) {
    echo $order->customer->name;          // one query per order
}
runs 51 queries: one for the orders, then one per order for its customer. Debugbar shows the same select * from customers where id = ? 50 times. Eager-load the relationship:
$orders = Order::with('customer')->latest()->take(50)->get(); // 2 queriesFor counts, use withCount('orders') instead of $customer->orders->count(), which loads every order just to count them. And turn on strict mode in development so lazy loading throws an error instead of silently running hundreds of queries:
// AppServiceProvider::boot()
Model::preventLazyLoading(! app()->isProduction());
The full N+1 explanation, with the SQL each version sends, is in Laravel: Eloquent vs Query Builder vs Raw SQL.
Fix 2: Don’t wrap indexed columns in functions (whereDate, whereYear)
Laravel’s date helpers are convenient, but look at the SQL they produce:
Order::whereDate('created_at', '2025-03-01')->get();
// select * from `orders` where date(`created_at`) = ?

Order::whereYear('created_at', 2025)->get();
// select * from `orders` where year(`created_at`) = ?
When the column is inside a function, MySQL can’t use the index on it, because the index is sorted by created_at, not by date(created_at). That’s the full scan in the EXPLAIN example above. Write a range instead:
Order::where('created_at', '>=', '2025-03-01')
     ->where('created_at', '<', '2025-03-02')
     ->get();

// or for a whole year
Order::whereBetween('created_at', ['2025-01-01 00:00:00', '2025-12-31 23:59:59'])->get();
The same rule applies to whereRaw('LOWER(email) = ?') and LIKE '%term%' (a leading wildcard can’t use an index either). This is one of the most common reasons an index “isn’t being used”, in any database. See Index Seek vs Index Scan for the other reasons.
Fix 3: Add the missing index in a migration
If EXPLAIN shows type: ALL and key: NULL for a filter you run all the time, add an index for it:
Schema::table('orders', function (Blueprint $table) {
    $table->index(['customer_id', 'status']);   // orders_customer_id_status_index
});
On the test table, where customer_id = 42 and status = 'paid' went from a full scan to reading about 10 rows with this index. Put the column you filter on with = first, and the range or sort column last. $table->foreignId('customer_id')->constrained() also creates an index on MySQL, since MySQL needs one for the foreign key.
Don’t index everything: each index slows down inserts and updates a little. Index the filters your slow queries actually use. The basics are in SQL Indexes Explained Simply.
Fix 4: Select only what you need
Order::all() and ->get() without select() fetch every column of every row and turn each row into a full model object. On a big table, that’s slow and uses a lot of memory:
// Only the columns the page shows
$orders = Order::select('id', 'customer_id', 'amount', 'created_at')->latest()->paginate(25);

// Just one column as a simple list
$emails = Customer::where('city', 'Manama')->pluck('email');

// Just a number: let the database count
$paid = Order::where('status', 'paid')->count();     // select count(*) ...
The worst version of this is loading rows only to add them up in PHP: Order::all()->sum('amount') loads the entire table, while Order::sum('amount') sends one SELECT SUM(...).
Fix 5: Paginate big tables the cheap way
paginate() runs two queries: the page of rows, plus a count(*) over the whole filtered table to show “page 3 of 2,481”. On a large table with complex filters, that count can be the slowest part. Two alternatives:
// No total count: just "Previous" / "Next" links
$orders = Order::latest()->simplePaginate(25);

// Cursor pagination: no count and no OFFSET
$orders = Order::orderBy('id')->cursorPaginate(25);
cursorPaginate() avoids another problem: OFFSET. For page 2,000, a normal paginate() sends limit 25 offset 49975, and MySQL has to read and throw away 49,975 rows first. Cursor pagination asks for “the next 25 after id 50,000” instead, which an index answers instantly. It suits infinite scroll and APIs; it can’t jump to an arbitrary page number.
Fix 6: Process large jobs in chunks
Exports, nightly jobs and data fixes that load a whole table at once will eventually run out of memory. Process them in pieces:
Order::where('status', 'pending')
     ->chunkById(1000, function ($orders) {
         foreach ($orders as $order) {
             // ...
         }
     });
chunkById reads 1,000 rows at a time using where id > ? (index-friendly, unlike OFFSET). And if all you’re doing is changing a column, skip the loop entirely: Order::where('status', 'pending')->update(['status' => 'cancelled']); is one query.
A quick routine for any slow page
- Open the page with Debugbar (or check Telescope / the slow query log).
- Count the queries. Dozens of near-identical ones? N+1: add
with(). - Find the slowest query and run
->explain()on it. type: ALLon a big table? Check for functions on columns (whereDate,whereYear,LOWER), then add an index.- Large
rowsbut small result? The index doesn’t match the filter; adjust it. - Check you’re selecting only the columns and rows you need, and paginating sensibly.
Common mistakes
- Testing with an almost empty database. Everything is fast with 50 rows. Seed realistic volumes (Laravel factories make this easy) before judging performance.
- Leaving Debugbar enabled in production. It’s a security risk and slows every page.
- Adding an index without checking
EXPLAINafterwards. Make sure MySQL actually uses it. - Using
whereDate/whereYearon large tables without realising they disable the index. - Caching around a slow query before understanding it. Caching hides the problem until the cache expires at the worst moment.
Practice exercises
Exercise 1. A dashboard shows 20 customers with their number of orders, and Debugbar shows 21 queries. What’s wrong, and what’s the fix?
Exercise 2. Rewrite Invoice::whereMonth('issued_at', 3)->whereYear('issued_at', 2026)->get() so MySQL can use an index on issued_at.
Exercise 3. An admin page lists 1.2 million log rows with paginate(50). Jumping to the last pages is very slow, and even page 1 takes two seconds. Name two improvements.
Answers
Answer 1. It’s an N+1: the code calls $customer->orders->count() (or similar) for each customer. Use Customer::withCount('orders')->take(20)->get() and read $customer->orders_count: one query in total.
Answer 2. Use a date range on the raw column:
Invoice::where('issued_at', '>=', '2026-03-01')
       ->where('issued_at', '<', '2026-04-01')
       ->get();
Answer 3. Use simplePaginate() to skip the expensive count(*) over 1.2 million rows, or cursorPaginate() to avoid both the count and the large OFFSET on later pages. Also make sure the sort column is indexed, and select only the columns the list shows.
Summary
- See every query with Debugbar or Telescope in development, and log slow ones with
DB::listenor the MySQL slow query log in production. - Understand a slow query with
->explain(): watch fortype: ALL,key: NULLand largerows. - Fix the usual suspects: N+1 queries, functions on indexed columns (
whereDate,whereYear), missing indexes, loading too many rows or columns, expensive pagination, and memory-hungry loops. - Test with realistic data volumes, and check
EXPLAINagain after every change.
Related articles
- Laravel: Eloquent vs Query Builder vs Raw SQL: the three ways to query, and the N+1 problem in detail.
- SQL Indexes Explained Simply: what an index is and when to add one.
- Index Seek vs Index Scan: why a query ignores your index (the same rules apply to MySQL).
- MySQL Explained for Beginners: the database behind most Laravel apps.