
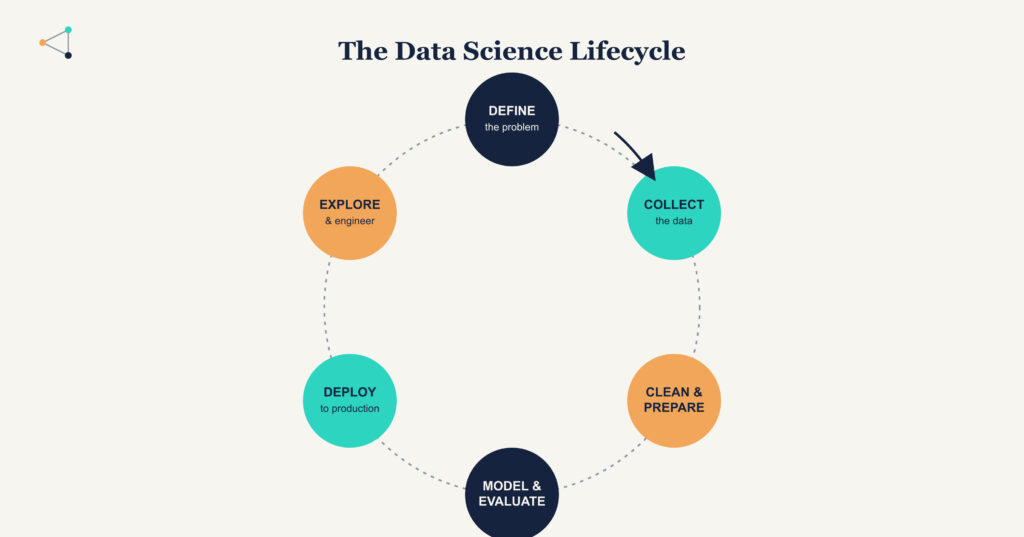
Data science can feel overwhelming to newcomers — there’s math, code, business strategy, and communication all rolled into one field. But at its core, almost every data science project follows a similar path from start to finish. Understanding this lifecycle helps beginners see the bigger picture instead of getting lost in any single step.
Step 1: Problem Definition
Every good data science project starts not with data, but with a question. Before touching a dataset, teams need to clarify:
- What business problem are we trying to solve?
- What does success look like?
- Is this even a problem data can solve?
For example, “Why are customers canceling their subscriptions?” is a vague starting point. A refined version might be: “Can we predict which customers are likely to cancel in the next 30 days, and what factors drive that decision?”
Step 2: Data Collection
Once the problem is defined, the next step is gathering the relevant data. This might come from:
- Internal databases (transactions, user logs, CRM systems)
- Public datasets or APIs
- Web scraping
- Sensors or IoT devices
- Third-party data providers
At this stage, data scientists also consider data governance — where the data is coming from, whether it’s being collected ethically, and whether the company has the right to use it.
Step 3: Data Cleaning and Preparation
This is often called the least glamorous — but most important — part of the process. Real-world data is messy. It may include duplicate entries, missing values, inconsistent formatting, or outright errors.
Common tasks in this phase include:
- Handling missing values (removing or imputing them)
- Removing duplicates
- Standardizing formats (dates, currencies, categories)
- Detecting and addressing outliers
It’s widely reported that data scientists spend a significant portion of their time — often the majority — on cleaning and preparing data rather than building models.
Step 4: Exploratory Data Analysis (EDA)
Before building any models, data scientists explore the dataset to understand its structure and spot patterns. This typically involves:
- Visualizing distributions with histograms, box plots, and scatter plots
- Checking correlations between variables
- Identifying trends, seasonality, or anomalies
EDA often reveals surprises — a variable that seemed irrelevant turns out to be a strong predictor, or a data quality issue emerges that needs to be fixed before moving forward.
Step 5: Feature Engineering
Raw data rarely feeds directly into a model. Feature engineering is the process of transforming raw variables into meaningful inputs a model can use. Examples include:
- Converting a “date of birth” into “age”
- Creating a “days since last purchase” feature from transaction timestamps
- Encoding categorical variables (like “country”) into numerical formats
Good feature engineering often has a bigger impact on model performance than the choice of algorithm itself.
Step 6: Model Building
This is the stage most people associate with “data science” — selecting and training a machine learning model. Depending on the problem, this could involve:
- Regression models (predicting a number, like sales revenue)
- Classification models (predicting a category, like churn: yes/no)
- Clustering algorithms (grouping similar customers together)
- Deep learning models (for image, text, or complex pattern recognition)
Data scientists typically test multiple models and compare their performance before choosing one to move forward with.
Step 7: Model Evaluation
A model is only useful if it performs well — and “well” needs to be measured carefully. Common evaluation metrics include:
- Accuracy, precision, and recall for classification problems
- Mean squared error (MSE) or R-squared for regression problems
- Cross-validation to test how well the model generalizes to new data
This step also involves checking for overfitting — when a model performs great on training data but poorly on new, unseen data.
Step 8: Deployment
Once a model proves reliable, it needs to be put into production so it can actually be used — whether that means integrating it into an app, a dashboard, or an automated business process. Deployment involves collaboration with software engineers and often requires:
- Building APIs to serve model predictions
- Setting up infrastructure to handle real-time or batch predictions
- Testing the model in a live environment
Step 9: Monitoring and Maintenance
Data science doesn’t end at deployment. Models can degrade over time as real-world conditions change — a phenomenon known as model drift. Ongoing monitoring involves:
- Tracking model performance over time
- Retraining models with fresh data
- Watching for changes in the underlying data patterns
Putting It All Together
The data science lifecycle isn’t always a straight line — teams often loop back to earlier stages as they learn more. A model evaluation might reveal the need for better features. A deployment issue might send the team back to data collection. This iterative nature is normal and expected.
Conclusion
For beginners, the data science lifecycle can serve as a mental map: define the problem, gather and clean the data, explore it, engineer useful features, build and evaluate a model, deploy it, and keep watching over it. Mastering each stage individually — and understanding how they connect — is the foundation for becoming an effective data scientist.
Related articles
- Big Data vs. Data Science vs. Data Analytics: how the three fields fit together.
- SQL for Complete Beginners: most data work starts with a SQL query.
- Data Lakes vs. Data Warehouses vs. Data Lakehouses: where large amounts of data are stored.
- The Five Vs of Big Data Explained with Real Examples: volume, velocity, variety, veracity and value.
- Data Cleaning in SQL: the data preparation step of the lifecycle, done in SQL.