
Users report an error that appears now and then, never when you try to reproduce it:
Msg 1205, Level 13, State 51
Transaction (Process ID 61) was deadlocked on lock resources with another process
and has been chosen as the deadlock victim. Rerun the transaction.
That’s a deadlock. Two sessions each hold a lock the other one needs, so neither can continue. SQL Server breaks the tie by cancelling one of them.
The good news: unlike most intermittent problems, SQL Server records every deadlock for you, with the exact queries involved. This guide shows how to find that record, how to read it, and the handful of fixes that solve most deadlocks.
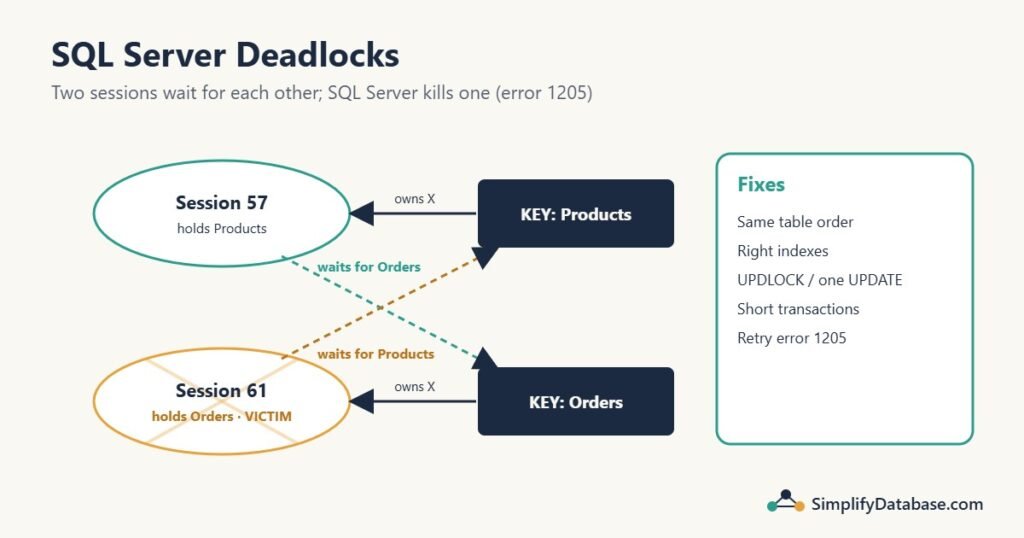
Table of Contents
Deadlock vs blocking
They’re related, but not the same:
| Blocking | Deadlock | |
|---|---|---|
| What happens | Session B waits for session A | A waits for B and B waits for A |
| Ends when | A commits or rolls back | SQL Server kills one of them |
| Symptom | Slow, or a timeout | Error 1205 straight away |
| Normal? | Short blocking is normal | Rare ones happen; frequent ones need fixing |
Blocking is a queue: annoying, but it resolves itself. A deadlock is a circle, and nothing inside the circle can break it. If your problem is long waits rather than error 1205, read SQL Server Blocking: How to Find the Blocking Session instead.
A deadlock in four steps
Here’s a simplified, made-up example you can run in two SSMS windows. One procedure takes stock and then marks the order; another does the same two steps in the opposite order.
Window 1:
BEGIN TRANSACTION;
UPDATE dbo.Products SET Stock = Stock - 1 WHERE ProductID = 10;   -- step 1
Window 2:
BEGIN TRANSACTION;
UPDATE dbo.Orders SET Status = 'Packed' WHERE OrderID = 500;      -- step 2
Window 1:
UPDATE dbo.Orders SET Status = 'Reserved' WHERE OrderID = 500; -- step 3: waits for window 2Window 2:
UPDATE dbo.Products SET Stock = Stock + 1 WHERE ProductID = 10; -- step 4: deadlockAfter step 3, window 1 holds the lock on product 10 and waits for order 500. At step 4, window 2 holds order 500 and asks for product 10. Each waits for the other. Within a few seconds, one window gets error 1205 and its transaction is rolled back; the other one continues as if nothing happened.
How SQL Server picks the victim
A background process called the lock monitor checks for deadlocks every 5 seconds (and more often once it starts finding them). When it finds a circle, it picks a victim:
- The session with the lower
DEADLOCK_PRIORITY, if they differ. - Otherwise, the session that’s cheapest to roll back, the one that has written the least to the transaction log.
The victim’s whole transaction is rolled back, not just the last statement. The application gets error 1205 and has to decide what to do: usually, try again.
Step 1: Find the deadlock report
You don’t need to set anything up. Since SQL Server 2012, the built-in system_health Extended Events session records every deadlock, with a full report in XML. This query reads them:
SELECT x.ev.value('(@timestamp)[1]', 'datetime2')           AS DeadlockTimeUtc,
       x.ev.query('(data/value/deadlock)[1]')                AS DeadlockGraph
FROM (
    SELECT CAST(event_data AS XML) AS EventXml
    FROM sys.fn_xe_file_target_read_file('system_health*.xel', NULL, NULL, NULL)
    WHERE object_name = 'xml_deadlock_report'
) AS d
CROSS APPLY d.EventXml.nodes('/event') AS x(ev)
ORDER BY DeadlockTimeUtc DESC;
Each row is one deadlock. The time is in UTC, so convert it to your local time before matching it with user reports.
Click the XML in the DeadlockGraph column. SSMS opens it as text. To see it as a picture, save that XML as a file with the extension .xdl and open the file in SSMS: it shows the deadlock graph.
You can also get there without a query: in Object Explorer, open Management → Extended Events → Sessions → system_health, double-click package0.event_file, and filter on the name xml_deadlock_report. The Deadlock tab shows the graph.
The system_health files roll over, so very old deadlocks disappear on a busy server. If you need a longer history, create your own Extended Events session that captures only xml_deadlock_report into a file.
Step 2: Read the deadlock graph
The graph has two kinds of shapes:
- Ovals are sessions (processes). The victim has a big blue X through it. Hover over an oval to see the SQL it was running.
- Rectangles are resources: the locked things. A rectangle says which object and index, for example
KEY: dbo.Orders, PK_Orders. - Arrows show who owns a lock (resource to session) and who is waiting for one (session to resource), with the lock mode:
X(exclusive, for changes),U(update),S(shared, for reads).
The XML has the same information in more detail. The parts to read:
<deadlock>
  <victim-list>
    <victimProcess id="process2a1" />
  </victim-list>
  <process-list>
    <process id="process2a1" spid="61" ... isolationlevel="read committed (2)">
      <inputbuf>UPDATE dbo.Products SET Stock = Stock + 1 WHERE ProductID = 10;</inputbuf>
    </process>
    <process id="process3b7" spid="57" ...>
      <inputbuf>UPDATE dbo.Orders SET Status = 'Reserved' WHERE OrderID = 500;</inputbuf>
    </process>
  </process-list>
  <resource-list>
    <keylock objectname="Shop.dbo.Products" indexname="PK_Products" mode="X">
      <owner-list><owner id="process3b7" mode="X" /></owner-list>
      <waiter-list><waiter id="process2a1" mode="X" requestType="wait" /></waiter-list>
    </keylock>
    <keylock objectname="Shop.dbo.Orders" indexname="PK_Orders" mode="X">
      <owner-list><owner id="process2a1" mode="X" /></owner-list>
      <waiter-list><waiter id="process3b7" mode="X" requestType="wait" /></waiter-list>
    </keylock>
  </resource-list>
</deadlock>
Read it as a story: session 57 holds Products and wants Orders; session 61 holds Orders and wants Products; 61 was chosen as the victim. Three questions to answer from every report:
- Which statements? The
inputbufof each process (it may show only the procedure name; theexecutionStackframes show the exact line). - Which objects and indexes? The
objectnameandindexnamein the resource list. - Which lock modes? Two
Xlocks means two writers.SvsXmeans a reader and a writer. That tells you which fix applies.
Step 3: Fix the cause
Most deadlocks fall into one of a few patterns.
1. Opposite order: access tables in the same order everywhere
That’s our example. One code path touches Products then Orders, another touches Orders then Products. The fix is a rule for the whole codebase: always change tables in the same order (for example, parent before child, or alphabetical). If both procedures update Products first, the second one simply waits in line at step 1, and there’s no circle.
The same applies to rows within one table: two sessions updating rows 1 and 2 in opposite orders can deadlock. Updating in a consistent order (by ID) prevents it.
2. Missing index: the query locks more rows than it needs
UPDATE dbo.Orders SET Status = 'Cancelled' WHERE CustomerEmail = @Email;Without an index on CustomerEmail, SQL Server has to scan the table, taking and checking locks on many rows on the way. Two sessions scanning the same table to update different customers can run into each other’s locks. With an index, each one seeks straight to its own rows and the paths never cross. Check the plans of the deadlocked statements for scans, and see Missing Indexes in SQL Server.
3. Reader vs writer on two indexes: the key lookup deadlock
A classic pattern when the report shows an S lock and an X lock on two different indexes of the same table:
- The reader seeks on a nonclustered index (takes
Son it), then does a key lookup into the clustered index. - The writer updates the row: it locks the clustered index first (
X), then needs to update the nonclustered index too.
Each holds one index and waits for the other. The fix is a covering index, so the reader never needs the key lookup: add the missing columns with INCLUDE. Index Seek vs Index Scan explains key lookups.
4. Read, then update: use UPDLOCK or one statement
-- Two sessions run this at the same time
BEGIN TRANSACTION;
SELECT @Stock = Stock FROM dbo.Products WITH (HOLDLOCK) WHERE ProductID = 10;
-- ... check the stock in code ...
UPDATE dbo.Products SET Stock = @Stock - 1 WHERE ProductID = 10;
COMMIT;
Under REPEATABLE READ or SERIALIZABLE (or with a HOLDLOCK hint like here), both sessions keep their shared lock from the SELECT. Then both try to convert it into an exclusive lock for the UPDATE, and each waits for the other’s shared lock to go away. This is a conversion deadlock.
Two fixes:
-- Fix A: take the update lock when reading. Only one session can hold U on the row,
-- so the second waits at the SELECT instead of deadlocking at the UPDATE.
SELECT @Stock = Stock FROM dbo.Products WITH (UPDLOCK, HOLDLOCK) WHERE ProductID = 10;

-- Fix B: do the check and the change in one statement
UPDATE dbo.Products
SET Stock = Stock - 1
WHERE ProductID = 10 AND Stock >= 1;
-- @@ROWCOUNT = 0 means "out of stock"
Fix B is usually best: one statement, no window between read and write.
5. Long transactions: keep them short
The longer a transaction holds its locks, the bigger the chance another session needs them in the wrong order. Never wait for user input inside a transaction, don’t call web services while it’s open, and do slow reads and calculations before BEGIN TRANSACTION. Big batch updates can be split into chunks of a few thousand rows. More on transactions in SQL Transactions and ACID Explained Simply.
6. Readers vs writers: consider RCSI
If most of your deadlocks involve a SELECT (an S lock) and an UPDATE, Read Committed Snapshot Isolation removes them: readers read the last committed version of the row instead of taking shared locks.
ALTER DATABASE Shop SET READ_COMMITTED_SNAPSHOT ON WITH ROLLBACK IMMEDIATE;It’s a database-wide change with costs (row versions are kept in tempdb, and code that relies on readers waiting for writers can behave differently), so test it first. It does nothing for writer-vs-writer deadlocks. NOLOCK hints are not a fix: they trade deadlocks for wrong results.
Step 4: Handle the ones that remain with a retry
Even a well-designed system will see a rare deadlock under heavy load. Since the victim’s transaction was fully rolled back, it’s safe to run it again. In T-SQL:
DECLARE @Attempt INT = 1;

WHILE @Attempt <= 3
BEGIN
    BEGIN TRY
        BEGIN TRANSACTION;
            UPDATE dbo.Products SET Stock = Stock - 1 WHERE ProductID = 10;
            UPDATE dbo.Orders   SET Status = 'Reserved' WHERE OrderID = 500;
        COMMIT;
        BREAK;                                   -- success: leave the loop
    END TRY
    BEGIN CATCH
        IF XACT_STATE() <> 0 ROLLBACK;

        IF ERROR_NUMBER() = 1205 AND @Attempt < 3
        BEGIN
            SET @Attempt += 1;
            WAITFOR DELAY '00:00:00.200';        -- short pause, then try again
        END
        ELSE
            THROW;                               -- other error, or out of retries
    END CATCH
END
The same idea works in application code: catch error 1205 and retry the whole transaction two or three times. In Laravel, DB::transaction(function () { ... }, 3) retries up to three times on a deadlock. In Delphi with FireDAC, check for error 1205 in the exception handler and repeat the StartTransaction ... Commit block.
A retry hides the symptom, so still look at the deadlock reports. If the same pair of statements shows up every day, fix the cause.
For background jobs that are less important than user actions, you can make them the preferred victim:
SET DEADLOCK_PRIORITY LOW;Checklist
- Confirm it’s a deadlock: error 1205, not a timeout.
- Pull the reports from system_health (
xml_deadlock_report), matching the UTC time. - For each report, note the statements, the objects and indexes, and the lock modes.
- Same tables, opposite order? Make the order consistent.
- Scans in the plans? Add the missing index.
SandXon two indexes of one table? Add a covering index.- Read-then-update? Use
UPDLOCKor a singleUPDATE. - Long transactions? Shorten them.
- Add retry logic for error 1205 as a safety net.
Practice exercises
Exercise 1. A user says they “sometimes get an error when saving an invoice”. How do you find out if it’s a deadlock, and what exactly was involved?
Exercise 2. A deadlock report shows session A holding X on dbo.Invoices and waiting for dbo.InvoiceLines, and session B holding X on dbo.InvoiceLines and waiting for dbo.Invoices. What’s the most likely fix?
Exercise 3. Why is it safe to simply retry a transaction that failed with error 1205?
Answers
Answer 1. Ask for the exact error message or check the application log for error number 1205. Then query the system_health session for xml_deadlock_report events around that time (remember the timestamp is UTC). The report lists the statements, the objects and indexes, and the lock modes of both sessions.
Answer 2. The two code paths change the same tables in opposite order. Make both save the invoice header and lines in the same order, for example always Invoices first, then InvoiceLines.
Answer 3. Because SQL Server rolled back the victim’s whole transaction. None of its changes were saved, so running it again from the start doesn’t apply anything twice. (That’s only true if the whole transaction is retried, not just the last statement.)
Summary
- A deadlock is a circle of waits; SQL Server ends it by rolling back one session with error 1205.
- Every deadlock is already recorded in the system_health Extended Events session. Read it with
sys.fn_xe_file_target_read_fileand open the XML as an.xdlgraph. - From each report, get the statements, objects, indexes and lock modes.
- The usual fixes: same access order, the right indexes (including covering ones),
UPDLOCKor single-statement updates, short transactions, and RCSI for reader-writer deadlocks. - Add retry logic for error 1205, and keep fixing the deadlocks that repeat.
Part of a series: this article is one step in my SQL Server Performance Troubleshooting: A Practical Step-by-Step Guide, which walks through the whole process of finding and fixing a slow query.
Related articles
- SQL Server Blocking: How to Find the Blocking Session: when sessions wait in a line rather than a circle.
- Missing Indexes in SQL Server: fewer rows touched means fewer locks to collide on.
- SQL Transactions and ACID Explained Simply: what a transaction is, and why it holds locks.
- How to Fix Query Timeout and Performance Issues in Delphi Applications: handling database errors and waits in a desktop app.