
“The GetCustomerOrders procedure is slow.” That’s a typical support ticket, and it’s frustrating to work on, because a stored procedure is a black box: twenty statements, a few IF branches, maybe a cursor, and somewhere in there something takes forty seconds.
The way out is to stop treating the procedure as one thing. This guide shows how to find which statement inside the procedure is slow, and then walks through the eight causes that explain almost every slow procedure, with the fix for each.
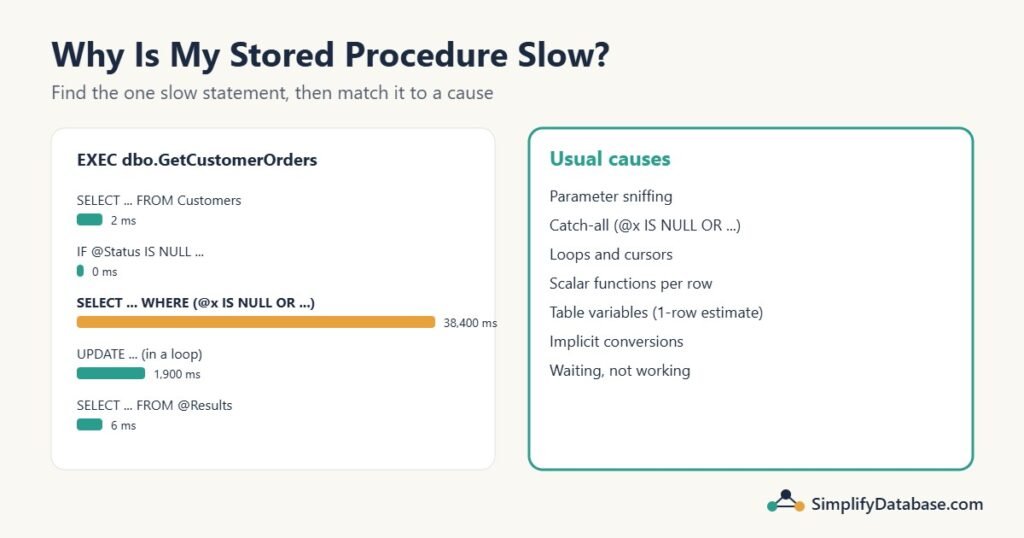
Table of Contents
Step 1: Confirm it’s slow, and how slow
Before changing anything, get numbers. Find the procedure’s history in the plan cache:
SELECT TOP (20)
       OBJECT_NAME(ps.object_id, ps.database_id)          AS procedure_name,
       ps.execution_count,
       ps.total_elapsed_time / ps.execution_count / 1000  AS avg_ms,
       ps.max_elapsed_time / 1000                         AS max_ms,
       ps.total_logical_reads / ps.execution_count        AS avg_reads,
       ps.last_execution_time
FROM sys.dm_exec_procedure_stats AS ps
WHERE ps.database_id = DB_ID()
ORDER BY ps.total_elapsed_time DESC;
This lists the procedures that use the most time in total. Look at the gap between avg_ms and max_ms. A procedure that’s always slow (average close to max) usually has a design problem. One that’s usually fast but sometimes very slow (max far above average) points to blocking or parameter sniffing.
These numbers reset when the server restarts or the plan is recompiled. If Query Store is on, it keeps a longer history.
Step 2: Find the slow statement inside the procedure
A procedure is a list of statements, and SQL Server tracks each one separately. This query breaks the procedure down statement by statement:
SELECT SUBSTRING(t.text,
                 qs.statement_start_offset / 2 + 1,
                 (CASE qs.statement_end_offset
                       WHEN -1 THEN DATALENGTH(t.text)
                       ELSE qs.statement_end_offset
                  END - qs.statement_start_offset) / 2 + 1)  AS statement_text,
       qs.execution_count,
       qs.total_elapsed_time / qs.execution_count / 1000     AS avg_ms,
       qs.total_logical_reads / qs.execution_count           AS avg_reads
FROM sys.dm_exec_query_stats AS qs
CROSS APPLY sys.dm_exec_sql_text(qs.sql_handle) AS t
WHERE t.objectid = OBJECT_ID('dbo.GetCustomerOrders')
ORDER BY qs.total_elapsed_time DESC;
The SUBSTRING with the offsets cuts the single statement out of the procedure’s full text. Usually one or two statements account for nearly all the time. That’s where to focus.
To see it live, run the procedure in SSMS with Include Actual Execution Plan (Ctrl+M) and these settings:
SET STATISTICS IO, TIME ON;
EXEC dbo.GetCustomerOrders @CustomerID = 42, @FromDate = '2026-01-01';
The Messages tab shows the reads and time for each statement, and the plan window shows one plan per statement. Look for the statement with the most logical reads or the highest “Query cost (relative to the batch)”. If plans are new to you, start with How to Read a SQL Server Execution Plan.
Careful: use the same parameter values the application uses. A procedure can be fast for one customer and slow for another, and testing with the wrong one hides the problem. Also, SSMS and most applications use different connection settings (ARITHABORT), so SSMS may even get a different plan. The parameter sniffing article explains how to test with the application’s plan.
Step 3: Match the slow statement to a cause
Cause 1: Parameter sniffing
The procedure is fast for most calls and slow for some, or it was fast yesterday and slow today with no code change. SQL Server built the cached plan for the first parameter values it saw, and that plan is bad for others (a seek plan reused for a customer with 500,000 orders, for example).
Fixes, from lightest to heaviest: add OPTION (RECOMPILE) to the one problem statement, use OPTIMIZE FOR, or split the logic into separate procedures for very different cases. The full story is in SQL Server Parameter Sniffing.
Cause 2: The “catch-all” search procedure
A search screen with optional filters often ends up like this:
SELECT OrderID, CustomerID, OrderDate, Amount
FROM dbo.Orders
WHERE (@CustomerID IS NULL OR CustomerID = @CustomerID)
  AND (@Status     IS NULL OR Status     = @Status)
  AND (@FromDate   IS NULL OR OrderDate >= @FromDate);
One plan has to work for every combination of filters, so SQL Server picks a safe one, which usually means scanning the whole table even when you pass a specific @CustomerID. It’s one of the most common causes of slow search screens.
Two fixes:
-- Fix A: recompile each time, so SQL Server builds a plan for the actual values
SELECT OrderID, CustomerID, OrderDate, Amount
FROM dbo.Orders
WHERE (@CustomerID IS NULL OR CustomerID = @CustomerID)
  AND (@Status     IS NULL OR Status     = @Status)
  AND (@FromDate   IS NULL OR OrderDate >= @FromDate)
OPTION (RECOMPILE);
-- Fix B: build only the conditions you need, and keep the parameters as parameters
DECLARE @sql NVARCHAR(MAX) = N'
SELECT OrderID, CustomerID, OrderDate, Amount
FROM dbo.Orders
WHERE 1 = 1';
IF @CustomerID IS NOT NULL SET @sql += N' AND CustomerID = @CustomerID';
IF @Status IS NOT NULL SET @sql += N' AND Status = @Status';
IF @FromDate IS NOT NULL SET @sql += N' AND OrderDate >= @FromDate';
EXEC sys.sp_executesql @sql,
N'@CustomerID INT, @Status VARCHAR(20), @FromDate DATE',
@CustomerID, @Status, @FromDate;Fix A is the simplest and fine for searches that run a few times a minute (each call pays a small compile cost). Fix B gives one cached plan per combination of filters and suits busy screens. Notice that Fix B never pastes the values into the SQL text: they’re passed to sp_executesql as real parameters, which keeps it safe from SQL injection.
Cause 3: Loops and cursors
DECLARE cur CURSOR FOR SELECT OrderID FROM dbo.Orders WHERE Status = 'Pending';
OPEN cur;
FETCH NEXT FROM cur INTO @OrderID;
WHILE @@FETCH_STATUS = 0
BEGIN
    UPDATE dbo.Orders SET Status = 'Cancelled' WHERE OrderID = @OrderID;
    FETCH NEXT FROM cur INTO @OrderID;
END;
CLOSE cur; DEALLOCATE cur;
This runs one UPDATE per order: 20,000 pending orders means 20,000 statements, each with its own overhead and log writes. The set-based version does it in one:
UPDATE dbo.Orders SET Status = 'Cancelled' WHERE Status = 'Pending';In the statement breakdown from Step 2, a loop shows up as a cheap statement with a huge execution_count. Most row-by-row logic, even with calculations, can be rewritten with joins, CASE and window functions. If a loop is truly needed, process batches of a few thousand rows per iteration rather than one row at a time.
Cause 4: Scalar functions in the SELECT
SELECT o.OrderID, dbo.GetCustomerBalance(o.CustomerID) AS Balance
FROM dbo.Orders AS o;
A scalar user-defined function that reads a table runs once per row. On 100,000 orders, that’s 100,000 extra queries hidden inside one innocent-looking statement, and the plan doesn’t show their cost properly. Older SQL Server versions also can’t run such a query in parallel.
SQL Server 2019 and later can inline many simple scalar functions automatically (check is_inlineable in sys.sql_modules). Otherwise, rewrite the function’s logic as a join or CROSS APPLY, or turn it into an inline table-valued function (a function that’s a single RETURN SELECT ...).
Cause 5: Table variables with many rows
A procedure fills a table variable with thousands of rows and then joins it to big tables. Before SQL Server 2019, SQL Server assumes a table variable holds 1 row, so it picks a plan made for one row. In the actual plan, look for Estimated rows: 1 on the table variable and an actual count in the thousands. Switch to a temp table. Details in Temp Tables vs Table Variables vs CTEs.
Cause 6: Data type mismatches (implicit conversion)
CREATE PROCEDURE dbo.FindCustomer @Email NVARCHAR(100)   -- the column is VARCHAR(100)
AS
SELECT CustomerID, Name FROM dbo.Customers WHERE Email = @Email;
NVARCHAR has higher priority than VARCHAR, so SQL Server has to convert the column’s values to NVARCHAR before comparing. With a SQL collation (such as the common default SQL_Latin1_General_CP1_CI_AS), that turns an index seek into a full scan; with a Windows collation it can still seek, but less efficiently. The plan shows a CONVERT_IMPLICIT warning (a yellow triangle on the SELECT operator). Make the parameter type match the column exactly. The same happens with numbers stored as text and INT vs BIGINT keys. Index Seek vs Index Scan lists the other ways to lose a seek.
Cause 7: Local variables hiding the values
DECLARE @Since DATE = DATEADD(day, -7, GETDATE());
SELECT ... FROM dbo.Orders WHERE OrderDate >= @Since;
When the plan is compiled, SQL Server doesn’t know the value of a local variable, so it uses an average guess instead of the histogram. Sometimes that’s fine; sometimes it’s badly wrong. If this statement is the slow one, add OPTION (RECOMPILE) (which lets SQL Server see the value), or pass the value in as a procedure parameter.
Cause 8: It’s not the procedure
Sometimes the procedure is fine and it’s waiting: blocked by another session, waiting for memory, or waiting for the application to read the results. If the elapsed time is much higher than the CPU time in STATISTICS TIME, the statement spent most of its time waiting. Check SQL Server Blocking and the timeouts guide for how to tell which wait it is.
Quick wins that are always worth having
These rarely fix a slow procedure on their own, but they belong in every one:
SET NOCOUNT ON;at the top. It stops the “(n rows affected)” message after every statement, which saves network round trips in procedures with many statements, and stops some older client libraries from getting confused.SET XACT_ABORT ON;in procedures with transactions, so an error or timeout rolls everything back instead of leaving locks behind.- Schema-qualify objects (
dbo.Orders, notOrders), so SQL Server doesn’t have to look up which schema you mean. - Return only the columns you need.
SELECT *can force key lookups and send unnecessary data.
Checklist
- Measure:
sys.dm_exec_procedure_statsfor average vs maximum time. - Find the slow statement:
sys.dm_exec_query_statsfiltered by the procedure, orSTATISTICS IO, TIMEand the actual plan. - Test with the application’s parameter values.
- Fast for some values, slow for others? Parameter sniffing.
- Optional filters with
@x IS NULL OR? Recompile or dynamic SQL. - Huge execution counts? A loop or a scalar function.
- Estimated 1 row, actual thousands? A table variable.
CONVERT_IMPLICITwarning? Fix the parameter type.- Elapsed much higher than CPU? It’s waiting, not working.
Practice exercises
Exercise 1. A search procedure with five optional filters always scans the Orders table, even when called with a specific @OrderID. What’s the likely cause and the simplest fix?
Exercise 2. In the statement breakdown, one UPDATE has an execution_count of 48,000 per call of the procedure, and an average time of 0.2 ms. Why is the procedure slow?
Exercise 3. A procedure’s parameter is declared @AccountNo NVARCHAR(20), and the column AccountNo is VARCHAR(20) with an index. The plan shows an index scan. Why, and how do you fix it?
Answers
Answer 1. It’s a catch-all query (@x IS NULL OR column = @x): one cached plan has to cover every combination of filters, so it scans. The simplest fix is OPTION (RECOMPILE) on that statement. For a very busy screen, use dynamic SQL with sp_executesql and parameters.
Answer 2. 48,000 × 0.2 ms is about 9.6 seconds. Each statement is fast, but it runs once per row: there’s a loop or cursor. Rewrite it as one set-based UPDATE (or batches of a few thousand rows).
Answer 3. An implicit conversion: SQL Server converts the VARCHAR column to NVARCHAR to compare it with the parameter, so (with a SQL collation) it can’t seek on the index. Change the parameter to @AccountNo VARCHAR(20) to match the column.
Summary
- Don’t tune “the procedure”. Find the statement that’s slow with
sys.dm_exec_query_statsorSTATISTICS IO, TIMEand the actual plan. - Test with the application’s real parameter values.
- The usual causes: parameter sniffing, catch-all queries, loops, scalar functions, table variables, implicit conversions, local variables, and waiting rather than working.
- Add
SET NOCOUNT ONandSET XACT_ABORT ONto every procedure.
Part of a series: this article is one step in my SQL Server Performance Troubleshooting: A Practical Step-by-Step Guide, which walks through the whole process of finding and fixing a slow query.
Related articles
- SQL Server Parameter Sniffing: the number one reason a procedure is fast one day and slow the next.
- SQL Stored Procedures Explained Simply: the basics, if you’re new to procedures.
- Temp Tables vs Table Variables vs CTEs: choosing where to keep intermediate results.
- SQL Server Query Timeouts: when the slow procedure ends in a timeout error.