
If you work with data, you almost certainly use Excel. It’s on every office computer, everyone understands it, and you can get an answer in a few clicks. So when someone says “you should learn SQL”, it’s fair to ask: why? What can SQL do that Excel can’t?
I work with finance and operations teams who live in Excel, and I write SQL every day, so I see both sides. This guide compares them honestly, shows the same task done both ways, and gives you a simple “Excel to SQL” translation table so your Excel skills carry straight over.
Quick answer:
Excel is a spreadsheet: you see the data and work on it by hand. It’s ideal for small data, quick calculations, charts and one-off analysis.
SQL is a language for asking a database questions. It’s ideal for large data, data split across many tables, many users, and reports that must be repeated reliably.
They work best together: SQL gets and summarises the data, Excel presents it. If you work with data regularly, learn both.
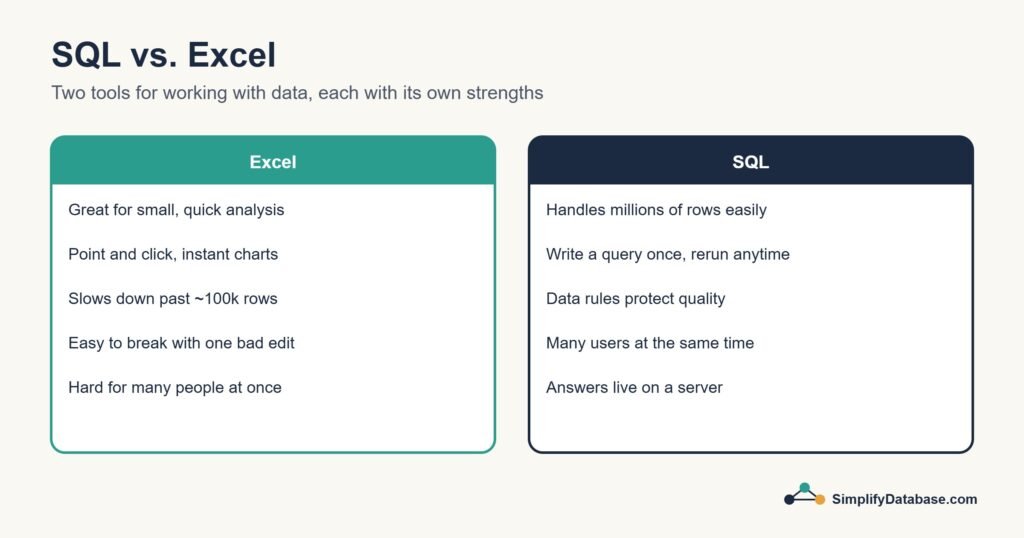
Table of Contents
The Main Difference in One Sentence
In Excel, you do the work: click, filter, drag formulas, copy and paste. In SQL, you describe the result you want, and the database does the work for you, on ten rows or ten million, as many times as you like.
What Excel Is Great At
Let’s be fair to Excel. For many jobs, it’s the right tool:
- Small and medium data. A few thousand rows open instantly and are easy to scan.
- Quick calculations.
SUM,IFand percentages take seconds to type. - Seeing the data. You can look at every cell, spot odd values and fix them by hand.
- Charts and formatting. Presentation-ready tables and charts with a few clicks.
- Pivot tables. Fast summaries without writing any code.
- Sharing. Almost everyone can open a spreadsheet.
A household budget, a list of class grades, a one-off price comparison: Excel is all you need.
Where Excel Starts to Struggle
The problems appear as the data, the number of people, or the number of repeats grows:
- Size. A worksheet stops at 1,048,576 rows, and files get slow long before that. (Excel’s Power Pivot data model can hold more, but at that point you’re already using database ideas.)
- Linking lists. Combining two sheets means
VLOOKUPorXLOOKUP, which break quietly when someone inserts a column or a value is spelled differently. - No rules. Anyone can type text into a number column, delete a formula, or paste over a row. The file accepts it without complaint.
- Copies everywhere. “Sales_final_v3_FIXED.xlsx” on one laptop, a different version in an email. Which one is right?
- Repeating work. Every month, someone repeats the same twenty clicks to rebuild the same report, and one missed step changes the result.
What SQL Is Great At
- Large data. Millions of rows are normal for a database.
- Connecting tables. Customers, orders and products are joined reliably with one line, using keys instead of text matching.
- Rules that protect the data. Number columns only accept numbers, and every order must belong to a real customer.
- One version of the truth. Everyone queries the same database, so everyone sees the same numbers.
- Repeatable reports. Write a query once, run it every month, and it gives exactly the same kind of answer every time, including the newest data.
- Working inside apps. Websites and business programs use SQL behind the scenes. Excel can’t do that.
Side-by-Side Comparison
| Excel | SQL | |
|---|---|---|
| Best for | Small data, hands-on analysis | Large or shared data, repeatable reports |
| Size | Up to ~1 million rows per sheet, slower well before that | Millions to billions of rows |
| Linking data | VLOOKUP / XLOOKUP | JOIN on keys |
| Data rules | None by default | Types, keys and constraints |
| Many users | Copies and conflicts | Built for it |
| Repeating a report | Repeat the clicks | Run the same query again |
| Seeing the data | Visual, every cell | Text results |
| Learning to start | Very easy | Easy for the basics |
The Same Task, Both Ways
Say you have every order from the last year, and you want total sales per country, highest first.
In Excel:
- Open the file and wait for it to load.
- Insert a PivotTable.
- Drag country to Rows and amount to Values.
- Make sure Values says Sum, not Count.
- Sort the total column from largest to smallest.
It works. But next month, with new orders, you do it all again, and you need to be sure everyone has the latest file.
In SQL:
SELECT country, SUM(amount) AS total_sales
FROM orders
GROUP BY country
ORDER BY total_sales DESC;
Four lines. Next month you run exactly the same query, and the new orders are included automatically. (This exact query, with a sample table you can create yourself, is explained step by step in SQL GROUP BY and Aggregate Functions.)
From Excel to SQL: A Translation Table
If you already know Excel, you know more SQL ideas than you think. Here’s how common Excel actions look in SQL:
| In Excel you… | In SQL you write… |
|---|---|
| Pick some columns to show | SELECT name, amount FROM orders |
| Use a filter | WHERE country = 'Egypt' |
| Sort a column | ORDER BY amount DESC |
Use SUMIF / COUNTIF | SELECT SUM(amount) FROM orders WHERE country = 'Egypt' |
| Build a pivot table | GROUP BY country with SUM, COUNT or AVG |
| Filter a pivot’s totals | HAVING SUM(amount) > 1000 |
Use VLOOKUP / XLOOKUP | JOIN customers c ON c.id = o.customer_id |
| Remove duplicates | SELECT DISTINCT country FROM orders |
Use an IF formula | CASE WHEN amount > 100 THEN 'Big' ELSE 'Small' END |
| Look at the top 10 rows | LIMIT 10 (SQL Server: SELECT TOP (10)) |
The lookup one deserves a closer look, because it’s where SQL saves the most pain. This adds the customer’s name to every order, like an XLOOKUP:
SELECT o.order_id, c.name, o.amount
FROM orders o
JOIN customers c ON c.id = o.customer_id;
It matches on an id number, not on text, so “Sara Ahmed” and “sara ahmed ” can’t cause a missed match. And it never breaks when someone inserts a column. SQL JOINs Explained Simply covers it fully.
SQL and Excel Work Best Together
This isn’t a competition. In most companies the two work as a team:
- SQL does the heavy lifting. It pulls exactly the rows you need from millions, joins the tables, and summarises them.
- Excel does the presentation. The small result goes into a spreadsheet for charts, comments and sharing.
Excel can even connect to a database directly. In Excel, Data > Get Data > From Database lets you pull a table or the result of a query from SQL Server (and, with the right driver, MySQL or PostgreSQL), and refresh it with one click. That’s often the best of both worlds: the data stays correct in the database, and the report stays in Excel. It’s also a great way to start using SQL at work without changing anyone else’s habits.
Which Should You Learn First?
Excel first, if you work in an office role (finance, HR, sales, operations) with small data, and most of your work ends in reports, charts or shared files.
SQL first, if you want a career in data analysis, software development or IT, if your company’s data lives in a database, or if you spend hours each month rebuilding the same reports.
Both, if you want to be a data analyst. SQL and Excel together are among the most requested skills in data job adverts. And if you already know Excel, you’re closer than you think: rows, columns, filters and totals are the same ideas in SQL.
How Long Does SQL Take to Learn?
Less time than most people expect. With 30 minutes of practice a day, most Excel users are comfortable with the core commands (SELECT, WHERE, ORDER BY, GROUP BY and JOIN) within two or three weeks. Those few commands cover most everyday reporting. SQL for Complete Beginners is a good first step.
Check Your Understanding
Excel, SQL, or both? Decide for each case, then read the answers.
- Planning a family holiday budget.
- A monthly sales report from 2 million orders that the manager wants every month.
- Finding which customers in the database haven’t ordered in six months.
- Making a chart of this year’s sales by region for a presentation.
- An online shop’s website saving every new order.
Answers
- Excel. Small, personal, one-off.
- SQL. Big data and a report that repeats every month.
- SQL. The data is in a database, and it needs a join between customers and orders.
- Both. SQL to get the totals, Excel to make the chart.
- SQL. The website writes to the database. A spreadsheet can’t do this job.
Frequently Asked Questions
Is SQL harder than Excel?
The basics are about equally easy, just different. Excel is easier for the first ten minutes because you can see everything. SQL pays you back once the data gets bigger or the work repeats.
Will SQL replace Excel?
No. They do different jobs. Most people who use SQL still use Excel, usually to present the results.
Is Power Query the same as SQL?
No, but they’re related ideas. Power Query is Excel’s tool for importing and cleaning data, with its own language called M. It’s great for repeatable clean-up steps. SQL is the language of the database itself. Many analysts use both: SQL to get the data, Power Query to shape it inside Excel.
Can I practise SQL on my Excel data?
Yes. Save a sheet as CSV and import it into a free database like PostgreSQL or SQL Server Developer Edition, or into a browser playground like SQLite Online. Practising on data you already understand makes SQL click much faster. Data Cleaning in SQL shows how to tidy imported data.
What to Learn Next
- SQL for Complete Beginners: your first queries.
- SQL GROUP BY and Aggregate Functions: pivot tables, the SQL way.
- SQL JOINs: XLOOKUP, the SQL way.
- SQL vs Python (pandas): the next comparison, when you’re ready.
Related articles
- What Is a Database?: why a shop moves from Excel to a database.
- SQL WHERE, ORDER BY and LIMIT: filtering and sorting, the SQL way.
- Data Cleaning in SQL: the clean-up you might do in Excel, done in SQL.
- 5 Best SQL Books for Absolute Beginners: if you prefer learning from a book.